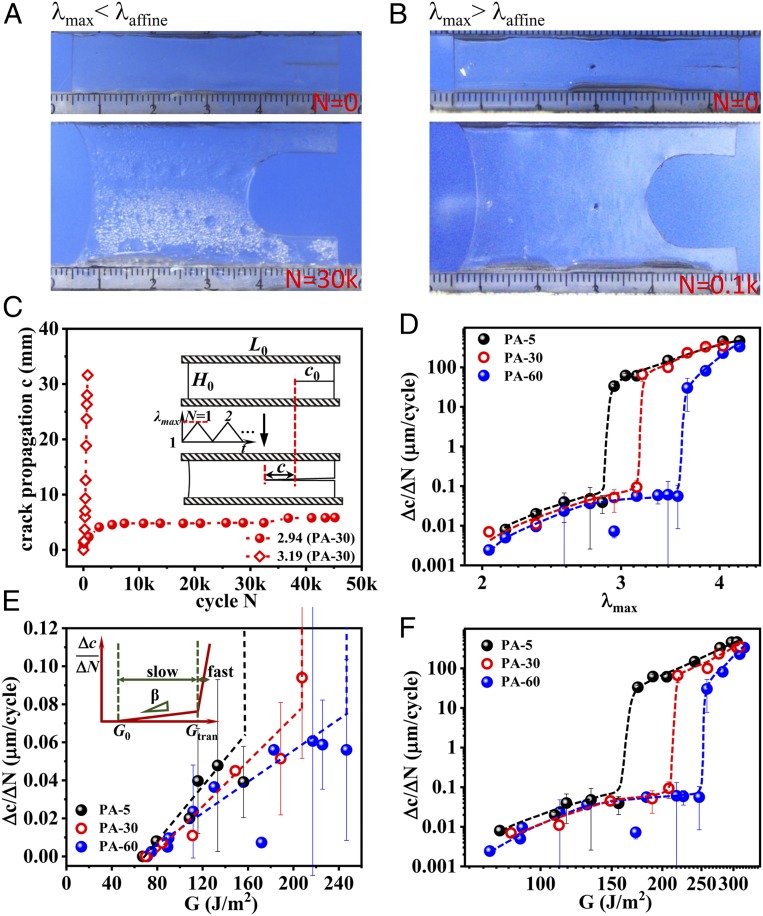
Fig. 3.
Delayed fatigue fracture of PA gels. (A and B) Shape of crack tip for fatigue test under λmax = 2.94 (<λaffine) at 30,000 cycles (A) and λmax = 3.19 (>λaffine) at 100 cycles (B) for PA-30 as a representative. (C) Crack propagation length c as a function of cycle N at elongation ratio λmax = 2.94 and 3.19 for PA-30. (Inset) The geometry of the sample applied in the fatigue test (width L0 = 50 mm, height H0 =10 mm, initial notch length c0 = 10 mm). (D) Δc/ΔN as a function of λmax for gels dialyzed at various temperatures Tdial. A transition for crack propagation from slow to fast mode is observed universally at λtran ∼ λaffine for all of the samples. The comparison of λtran and λaffine is shown in Fig. 2D. (E) The enlarged slow mode regime for Δc/ΔN as a function of energy release rate G. A linear relation Δc/ΔN = β(G − G0) at G0 < G < Gtran, is observed (as schemed in Inset). The G0, β, and Gtran are shown in Table 1. (F) The Δc/ΔN as functions of G in log-log plot. Δc/ΔN jumps from a low plateau (<0.1 µm per cycle) to a high value (>10 µm per cycle) at G = Gtran. The dashed lines are guides for the eyes. The average crack advance velocity Δc/ΔN is estimated from the slope at steady state. The Δc/ΔN values at the boundary of the transition regime in D, E, and F are obtained from the statistical average values of the high probability mode at the corresponding λmax (see SI Appendix, Fig. S5).

