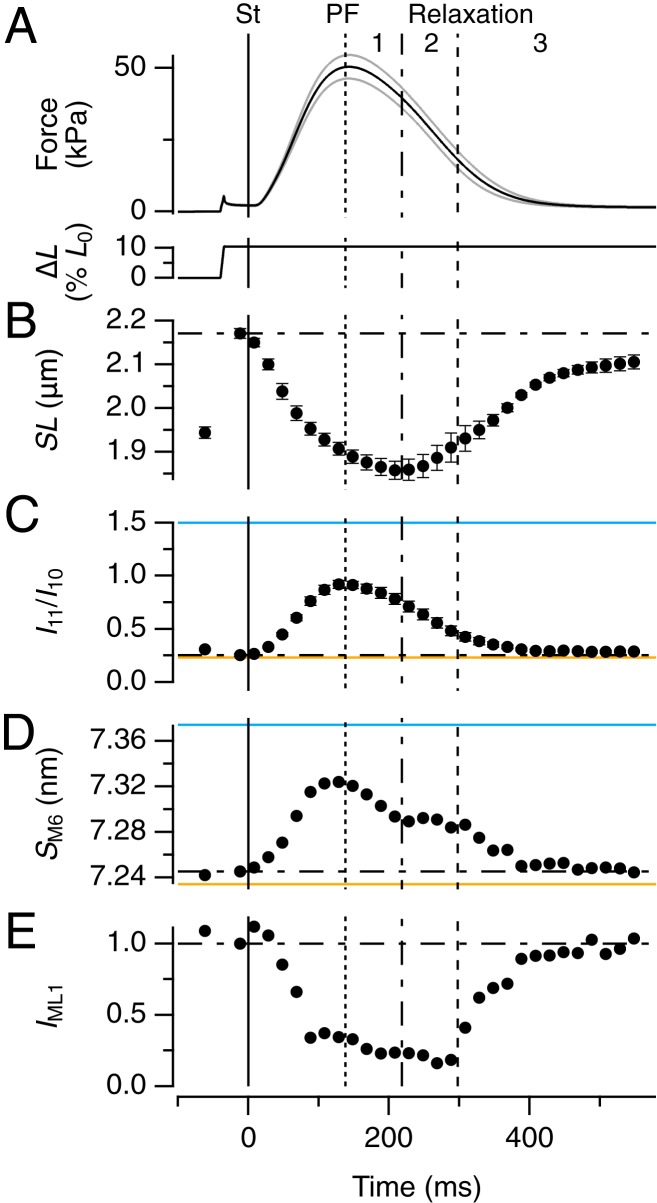
Fig. 2.
Structural dynamics of myosin motors and filaments during the heartbeat. (A) Force and trabecular length change (ΔL, expressed as a percentage of initial length [L0]); vertical continuous line at t = 0 indicates the electrical stimulus (St). Vertical dotted, dot-dashed, and dashed lines indicate PF and the end of phase 1 and 2 of relaxation, respectively. Gray traces show ± SEM for force; n = 6 trabeculae. (B–E) Changes in SL (B), ratio of equatorial intensities (I11/I10, C), spacing of M6 reflection (SM6, D) and intensity of ML1 reflection (IML1, E). Error bars in B and C are SEM for n = 6 trabeculae; data in D and E added from the same 6 trabeculae. Spatial calibration described in Materials and Methods. Horizontal dot-dashed lines indicate the value of each parameter before the stimulus. Horizontal continuous lines in C and D from two demembranated trabeculae in relaxation at [Ca2+] = 1 nM (orange) and during active isometric contraction at [Ca2+] = 20 µM (blue), force 95 kPa.

