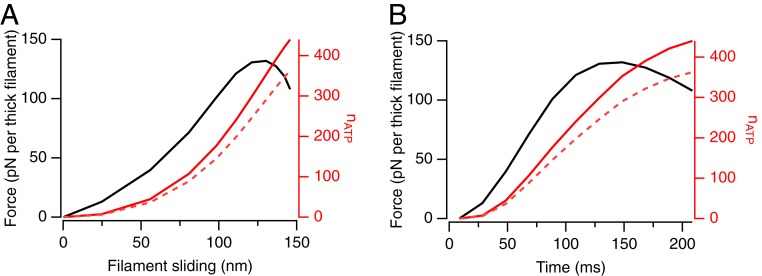
Fig. 4.
ATP hydrolysis per half-filament during force development and up to peak shortening. Force (black) and the number of ATPs hydrolyzed per half-filament (red), calculated as described in the main text from thermodynamic efficiency (red continuous line) or from the assumption that motors remain attached to actin over a 6-nm stroke (red dashed line), plotted against filament sliding (A) or time (B).

