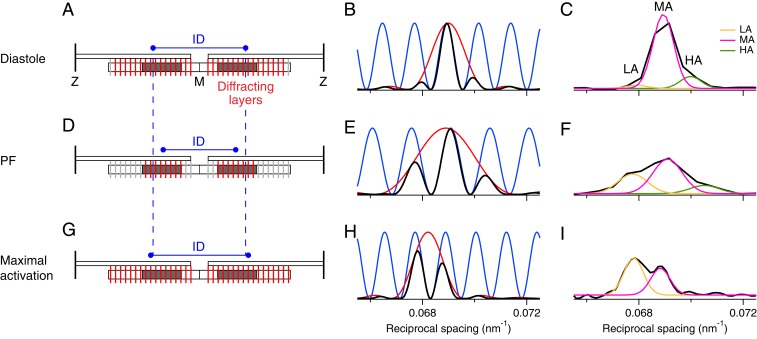
Fig. 5.
Determining the location of diffracting motors in the myosin filament by X-ray interference. The Left column (A, D, and G) shows the (red) ordered layers of myosin motors in each half-thick filament in the sarcomere that contribute to the M3 X-ray reflection and the (light gray) disordered layers that do not. Only one of every three layers of motors is shown for simplicity. The center-to-center distance between the ordered layers is the interference distance (ID, blue). The C-zones are shaded dark gray. The Center column (B, E, and H) shows the intensity distribution of the M3 reflection that would be produced by a single array of ordered motors in each half filament (red), the fringes (blue) produced by interference between the two arrays in each filament, and the product of the red and blue functions, the resulting M3 profile (black) for the parameter set specified in SI Appendix. The Right column (C, F, and I) shows corresponding experimental M3 profiles (black) fitted by multiple Gaussian functions for the lower (LA, orange), middle (MA, magenta), and higher (HA, green) angle peaks. Data in C and F added from six trabeculae, in I from two. The Top row (A–C) is for intact trabeculae in diastole, the Middle row (D–F) for intact trabeculae at peak force, and the Lower row (G–I) for demembranated trabeculae at full calcium activation. Note that the calculated profiles (Center column) do not include the broadening due to the point-spread function of the camera/detector system in the experimental profiles (Right column), but this difference is avoided in the analysis presented in the text by Gaussian fitting both experimental and calculated profiles.

