Fig. 4.
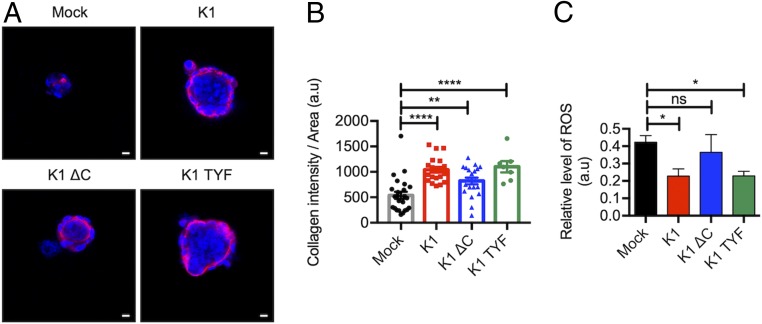
K1 induces collagen synthesis and reduces ROS in 3D spheroids. (A) Representative confocal image of collagen I (red) and K1 (green) immunofluorescence on mock-, K1 WT-, or mutant-expressing TIME and HFF cell cocultured spheroids in ultralow attachment condition. Nuclei were stained with Hoechst 33342 (blue). (Scale bars: 10 μm.) (B) Quantification of collagen I signal intensity in 3D spheroids. Collagen intensity of spheroids was divided by areas of spheroids. Data are mean ± SEM. **P < 0.01 and ****P = 0.0001, by one-way ANOVA. (C) Intracellular ROS level in mock-, K1 WT-, or mutant-expressing TREX 293T cell spheroids. a.u., arbitrary units. Data are mean ± SEM. *P < 0.05; ns, not significant, by one-way ANOVA.

