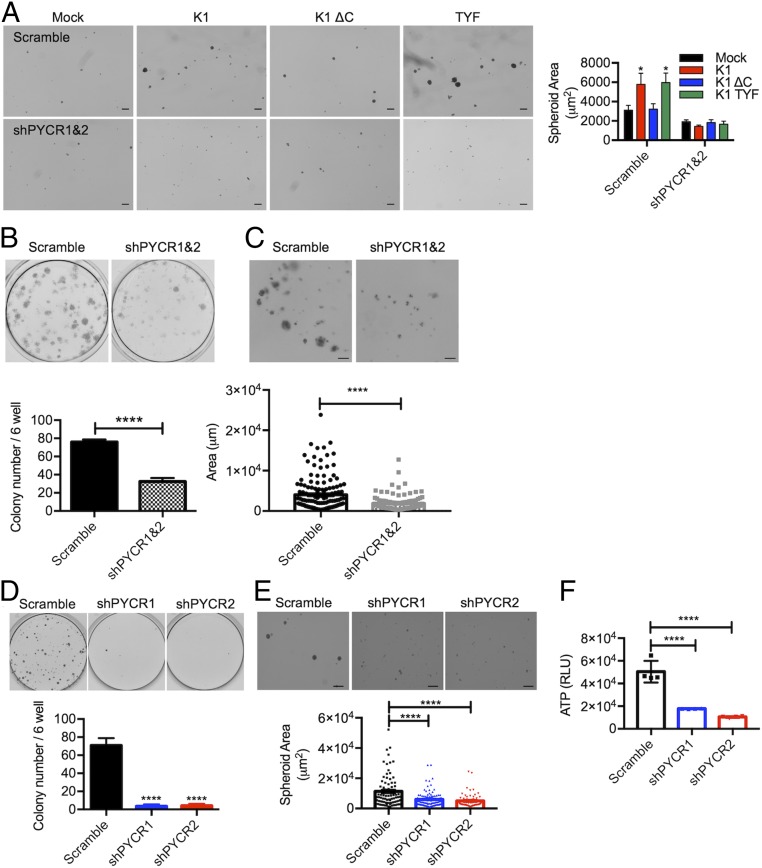
Fig. 5.
PCYR expression and interaction are essential for K1-mediated transformation. (A) Representative pictures of mock-, K1 WT-, or mutant-expressing TIME cells treated with scramble shRNA (scramble) or PYCR-specific shRNA (shPYCR1/2) in ultralow attachment condition. Right graph shows size quantification of the spheroids. (Scale bars: 200 μm.) *P < 0.05, by two-way ANOVA. (B) Scramble- or shPYCR-treated KSHV-infected TIME cells were subjected to low-density culture (1,500 cells per six-well plates) for clonogenic assay. Representative pictures for colony growth are shown (Upper). Quantification of the number of colonies is shown (Lower). Data are presented as the mean ± SD. ****P < 0.0001, by Student’s t test. (C) Representative pictures and size quantification of 3D spheroids of scramble- or shPYCR-treated KSHV-infected TIME cells cultured in ultralow attachment condition with 4% Matrigel. (Scale bars: 100 μm.) Data are presented as the mean ± SEM. ****P < 0.0001, by Student’s t test. (D) Scramble- or shPYCR-treated KMM cells were subjected to low-density culture (1,000 cells per six-well plates) for clonogenic assay. Representative pictures for colony growth are shown (Upper). Quantification of the number of colonies is shown (Lower). Data are presented as the mean ± SD. ****P = 0.0001, by one-way ANOVA. (E) Representative pictures and size quantification of 3D spheroids of scramble control- or shPYCR-treated KMM cells cultured in ultralow attachment condition. (Scale bars: 400 μm.) Data are presented as the mean ± SEM. ****P = 0.0001, by one-way ANOVA. (F) Intracellular ATP levels of scramble control or shPYCR KMM cells are seeded in ultralow attachment condition. Intracellular ATP levels were measured as an indicator of cell viability using CellTiter-Glo reagents after 4 d of shRNA treatment. Data are presented as the mean ± SD. The number of biological replicates for each experiment was n ≥ 3. ****P = 0.0001, by one-way ANOVA.

