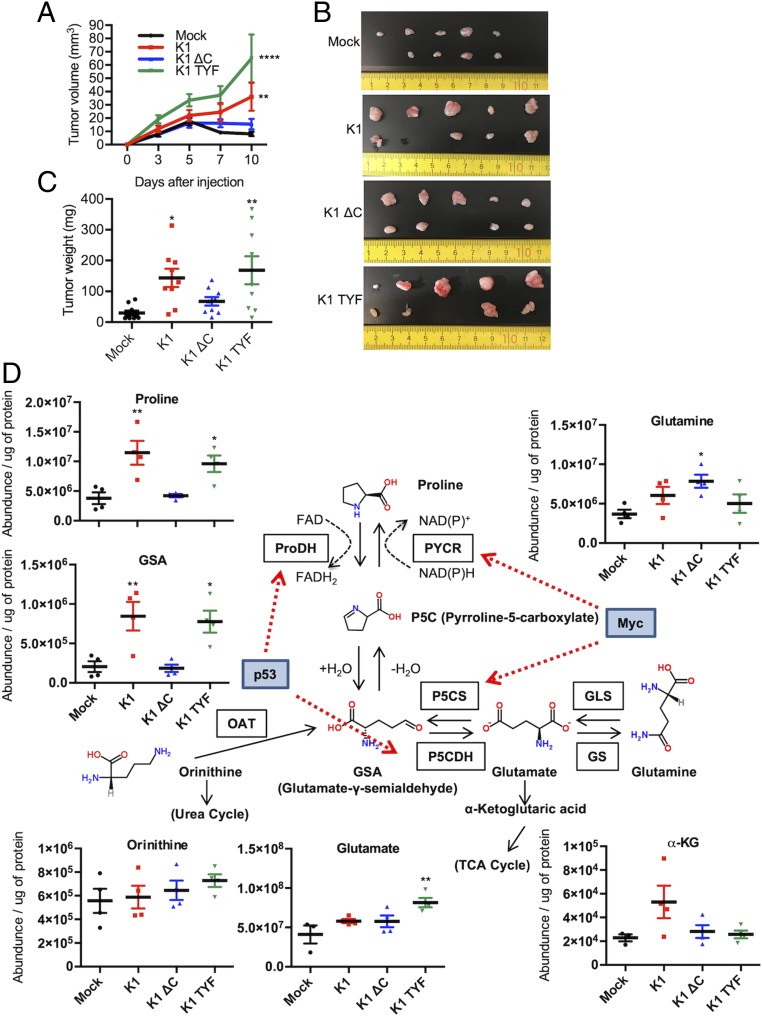
Fig. 6.
Proline metabolic differences between in vivo tumors. (A) MDA-MB-231 cells (1 × 10⁶ cells) expressing mock, K1 WT, or mutants were injected s.c. into nude mice (n = 9 to 10). Tumor volume was plotted as indicated. Data are presented as the mean ± SEM. **P < 0.01 and ****P = 0.0001, by two-way ANOVA. At 11 d after injection, xenograft tumors were (B) harvested and (C) weighed. Data are presented as the mean ± SEM. *P < 0.05 and **P < 0.01, by one-way ANOVA. (D) Metabolite abundance of proline metabolism pathway in mock-, K1 WT-, or mutant-expressing MDA-MB-231 tumors measured by LC-MS. Levels of metabolites are related to proline synthesis. Data are presented as mean ± SEM. *P < 0.05 and **P < 0.01, by one-way ANOVA.

