
Figure 3.
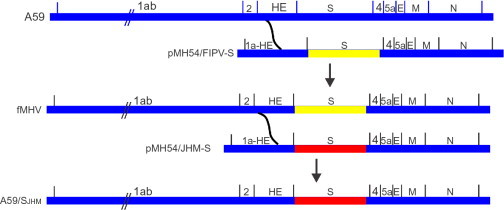
Targeted recombination. A schematic representation of targeted recombination. A59 sequences are shown in blue, FIPV S ectodomain sequences are shown in yellow, and JHM sequences are shown in red. Based on Kuo et al. (2000).
Official websites use .gov
A
.gov website belongs to an official
government organization in the United States.
Secure .gov websites use HTTPS
A lock (
) or https:// means you've safely
connected to the .gov website. Share sensitive
information only on official, secure websites.
Targeted recombination. A schematic representation of targeted recombination. A59 sequences are shown in blue, FIPV S ectodomain sequences are shown in yellow, and JHM sequences are shown in red. Based on Kuo et al. (2000).