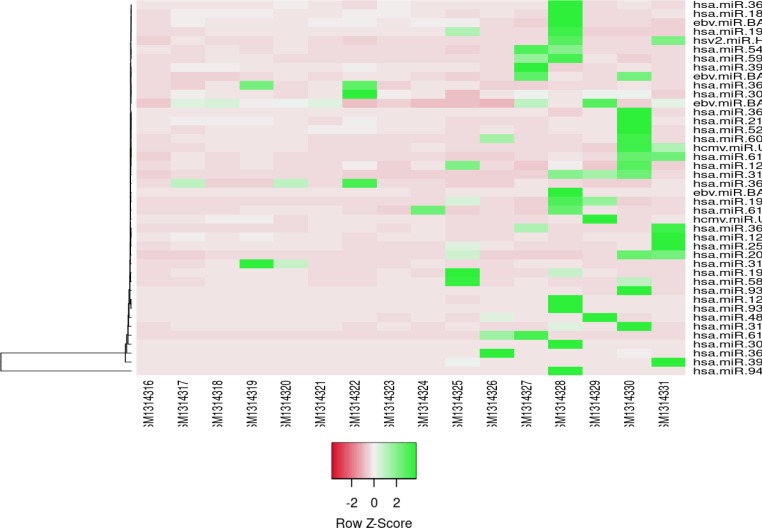
Figure 2.
Heatmap presentation of differentially expressed (DE) microRNAs profiles of gastric cancer HP+ and gastric cancer HP- samples. GSM314316-23 and GSM314324-31 refer to gastric cancer HP+ and gastric cancer HP- samples, respectively. Clustering method; average linkage and distance measurement method; Euclidean was applied

