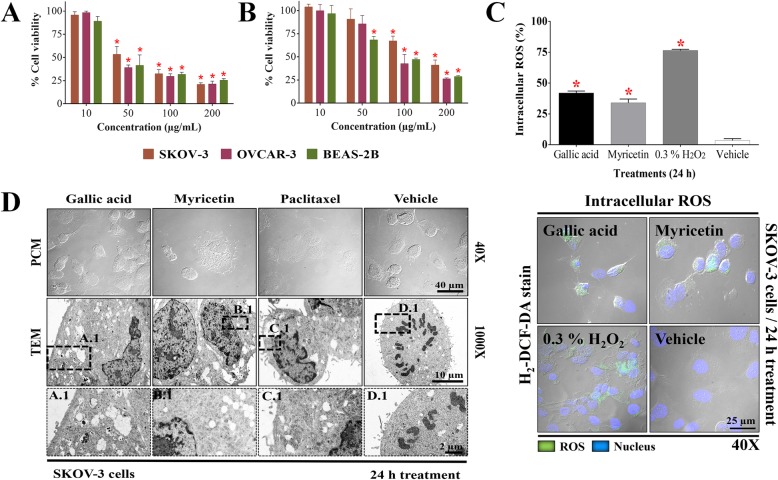
Fig. 2.
Biological activity of GA and Myr in ovarian cancer cells. The IC50 of GA (a) and Myr (b) in SKOV-3, OVCAR-3, and BEAS-2B cell lines was obtained with dose-response viability curves at 24 h by MTT assay. Intracellular production of ROS (c) and ultra-structural changes (d) in SKOV-3 cells were analyzed by H2-DCF-DA and TEM respectively, after 24 h of treatment with GA (50 μg/mL) and Myr (166 μg/mL). The boxes represent optical magnification made in TEM analysis for the corresponding treatments (A.1 GA, B.1 Myr, C.1 paclitaxel, D.1 vehicle). Results show the mean ± S.D. of three biological replicates (n = 3, in triplicates); *, p ≤ 0.05 vs the control group without treatment (0.5% DMSO in 1X PBS - 100% viability, ANOVA). Paclitaxel was used as a positive control at 5 μg/mL. ROS, reactive oxygen species; PCM, phase-contrast microscopy; TEM, transmission electron microscopy

