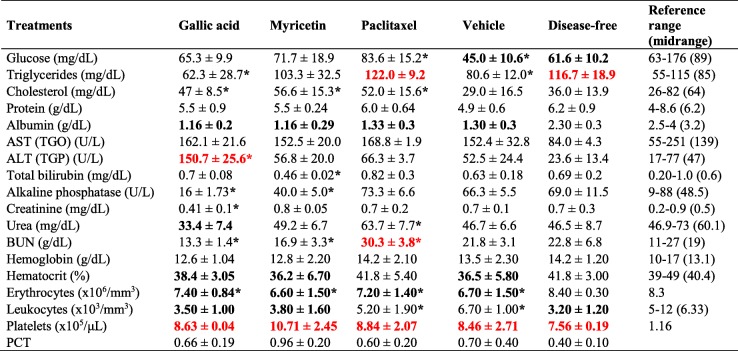
Table 3.
Paraclinical studies in Nu/Nu mice treated with GA and Myr
Results show the mean ± S.D. of two biological replicates (n = 5)
The numbers in red and bold black indicate higher and lower differences respectively in relation to reference values for mice
*, p < 0.05 vs values of vehicle group (0.5% DMSO in 1X PBS, ANOVA)
Reference range, minimum and maximum normal value for the analyte of interest in mice and the respective midrange [32, 41, 42]
AST (TGO) aspartate aminotransferase, ALT (TGO) alanine aminotransferase, BUN blood urea nitrogen, PCT platelecrit

