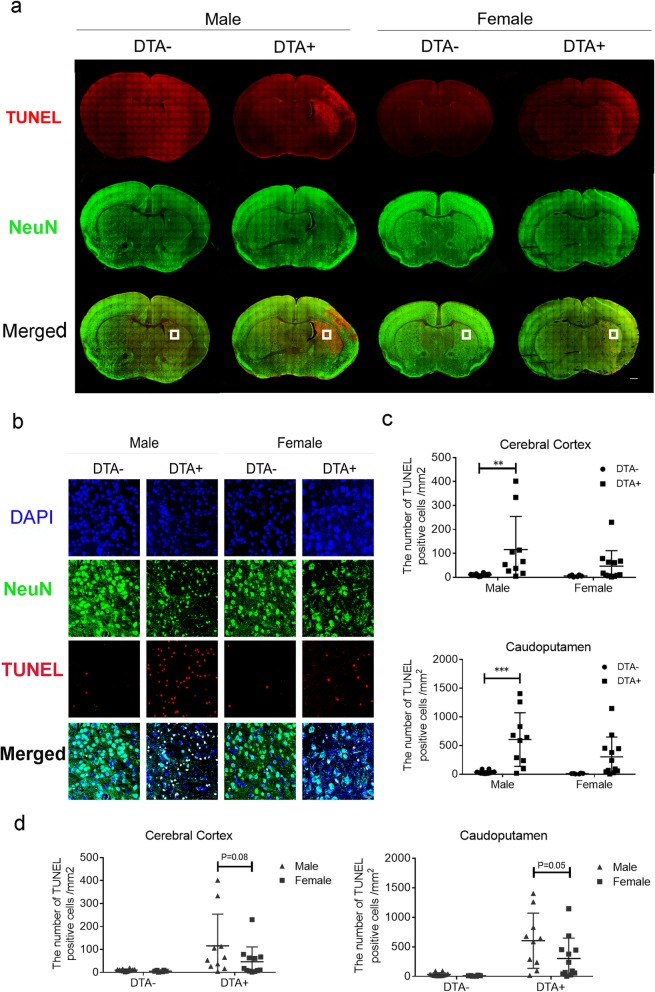
Fig. 4.
TUNEL and NeuN staining at P13 following HI insult at P10. a Representative image of co-immunofluorescent staining at the striatum level. The scale bar indicates 500 μm. b High magnification of the TUNEL+ area at the striatum level in each gender and genotype in the square shown in Fig. 1. Scale bar indicates 20 μm. c Quantification of TUNEL+ cells/mm2 in the caudoputamen and cerebral cortex. d Comparison of sex differences within the same genotype. The number of TUNEL-positive cells in each interest region at P13 following HI insult at P10 (DTA− male, n = 12; DTA+ male, n = 10; DTA− female, n = 6; DTA+ female, n = 12) **P < 0.01, ***P < 0.001. For the caudoputamen, two-way ANOVA was performed followed by the Bonferroni multiple comparison test. For the cerebral cortex, the Kruskal-Wallis test was performed followed by Dunn’s multiple comparison test. Bars depict mean ± SD

