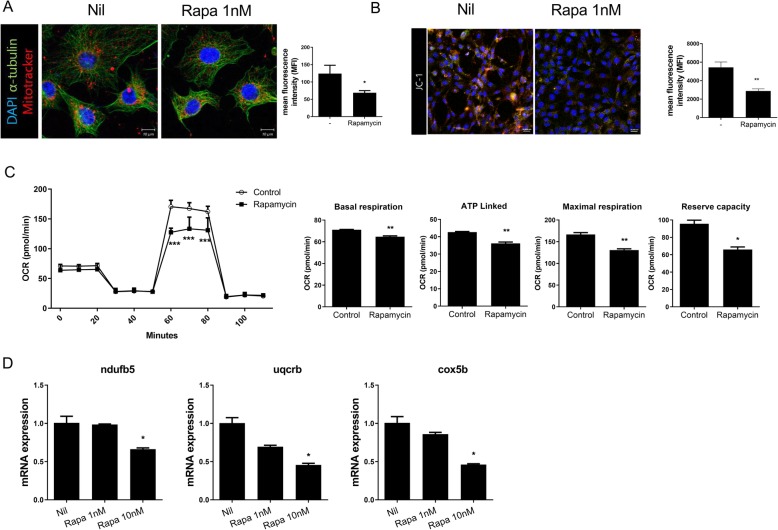
Fig. 2.
Mitochondrial dysfunction induced by rapamycin. a NIH3T3 cells were stained with MitoTracker Red CMXROS (red), anti-α-tubulin (green), and 4′,6-diamidino-2-phenylindole (DAPI; nuclei, blue), and the mitochondrial was quantified on confocal micrographs. b Mitochondrial membrane potential was measured using JC-1 dye and confocal microscopy. c Oxygen consumption rates (OCR) in the presence and absence of rapamycin. Oligomycin 2 μM, FCCP 3 μM, antimycin A 5 μM, and rotenone 5 μM were treatment in cells for OCR measurement. d Mitochondrial oxphos gene expression levels in the presence and absence of rapamycin, as determined by qRT-PCR. Data represent the mean ± SD of three independent experiments. *P < 0.05, **P < 0.01, and ***P < 0.001

