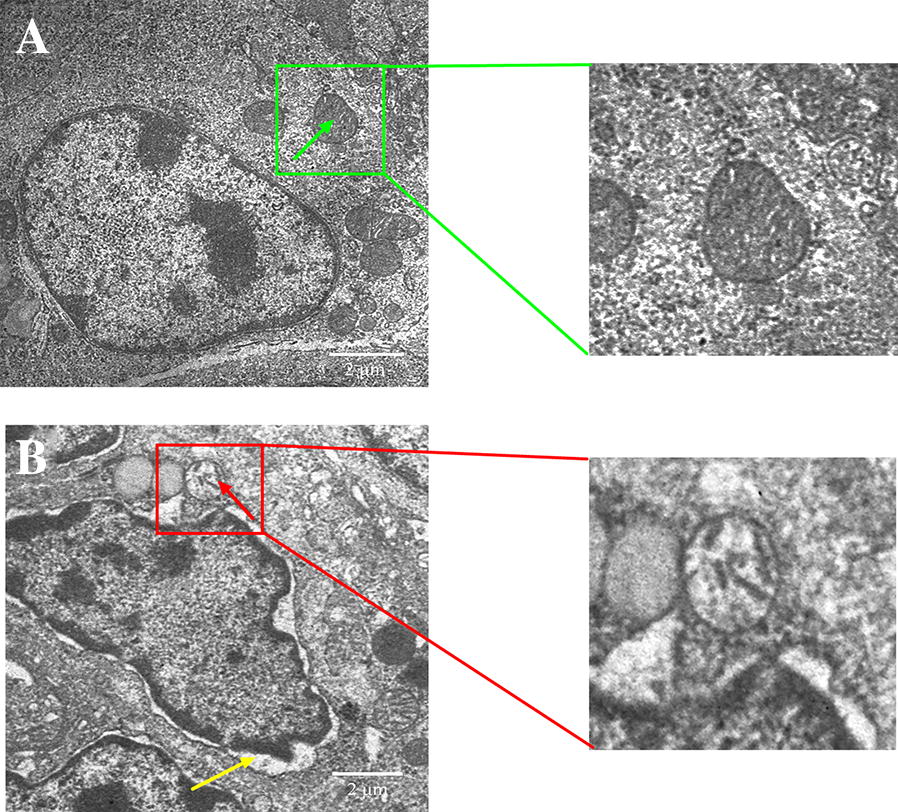
Figure 2.

Ultrastructural analysis showing the effect of MG-infection on chicken thymus. Ultrastructural analysis (Figure 3) was performed at day 7 post-infection. Experimental groups are represented as (A) control group and (B) MG-infection group (n = 3). It is clear from the ultrastructural photomicrographs (zooming area) that the mitochondria (green arrow) are intact and clearly visible in the control group. In contrast, mitochondrial swelling (red arrow), increased intercellular space, nuclear lysis, and cell membrane deformation (yellow arrow) were present in the MG-infection group.
