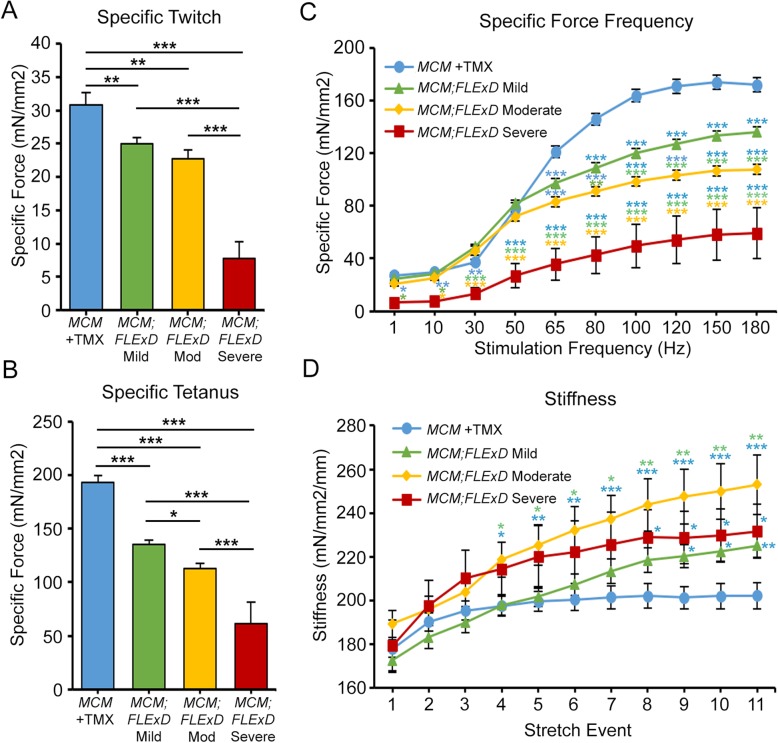
Fig. 5.
Ex vivo muscle function analysis shows DUX4-induced muscle weakness. EDL muscles from female ACTA1-MCM/+ with TMX (MCM, blue, n = 9), mild model (MCM;FLExD Mild, green, n = 9), moderate model (MCM;FLExD Mod, yellow, n = 6), and severe model (MCM;FLExD Severe, red, n = 3) were assayed for maximum twitch, maximum tetanus, and force frequency (Figure S7, not normalize) and then normalized, here, to muscle cross sectional area to provide a specific twitch, b specific tetanus, and c specific force frequency at MD14 and SD10. d Muscle stiffness calculated from eccentric contractions analysis showed all three model mice have stiffer muscle than control. Data are mean ± S.D. with significance *p < 0.05, **p < 0.01, ***p < .001. For panel c, blue asterisks indicate significance compared with MCM +TMX control mice, green asterisks indicate significance compared with mild bi-transgenic mice, and yellow asterisks indicate significance compared with moderate model mice

