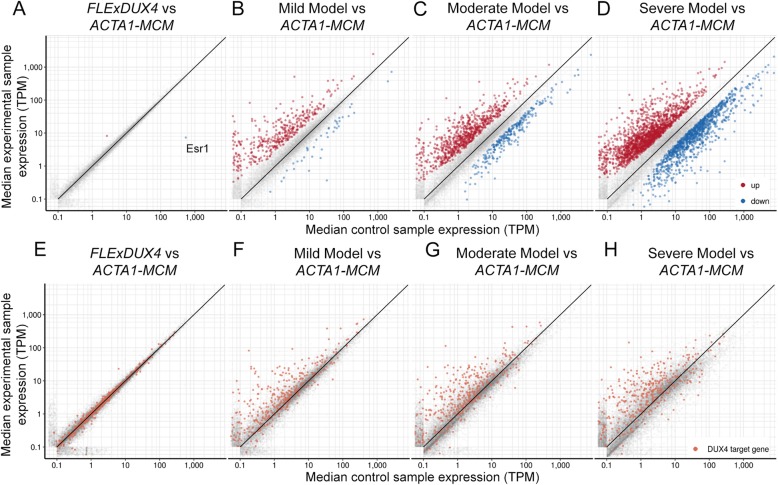
Fig. 6.
Comparison of gene expression in muscle from FSHD-like models compared with controls. a–d Scatter plots showing differentially expressed genes in RNA-seq data derived from gastrocnemius muscles isolated from aFLExD/+ mice, b bi-transgenic mild model mice, c bi-transgenic moderate model mice, and d bi-transgenic severe model mice (y-axis), each compared with ACTA1-MCM control mice (x-axis). Significantly upregulated genes are indicated in red, and downregulated genes are indicated in blue. e–h Above scatter plots highlighting the DUX4-induced genes similarly induced by DUX4 in C2C12 myoblasts [25]

