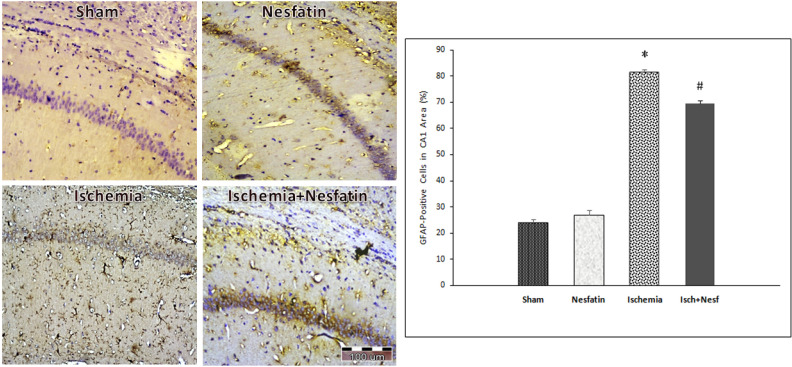
Figure 4.
The percentage of glial fibrillary acid protein (GFAP) positive cells in different groups
Left: Photomicrographs of immunohistochemical staining of GFAP in the hippocampal CA1 area after transient cerebral ischemia (400× magnifications)
Right: Effects of nesfatin-1 on the GFAP levels in the CA1 area following cerebral ischemia
* Significantly different compared with sham and nesfatin-1 groups (P<0.001)
# Significantly different compared with the ischemia group (P<0.05

