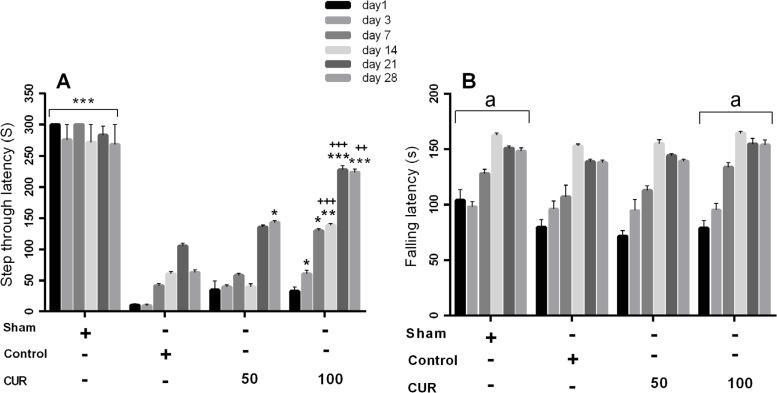
Figure 3.
Bars represent Mean±SEM
A. STL time; B. Falling latency time (s) at days 1, 3, 7, 14, 21, and 28 following GCI in sham group and in rats received vehicle (control), curcumin 50 mg/kg (CUR50), or curcumin 100 mg/kg (CUR100) for 28 days
*P<0.05; **P<0.01; ***P<0.001 significantly different from the control group
+P<0.05; ++P<0.01; +++P<0.001 significantly different from CUR50
a P<0.01: The mean of total latency to fall time throughout the study period significantly different from the control group

