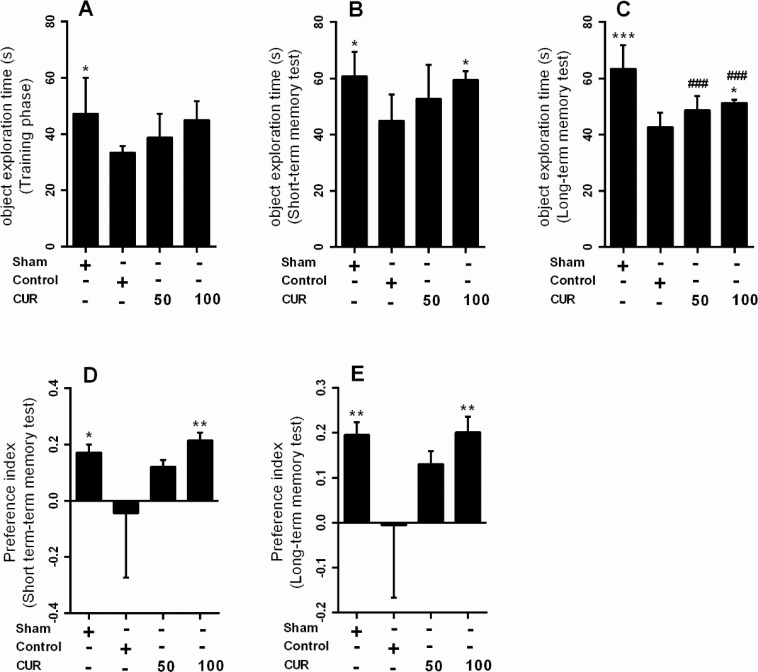
Figure 5.
Box plots represent Mean±SEM of exploration times (n=7/group)
A. The novel objects in training; B. Short-term; C. Long-term memory; D. Phases, novelty preference index for short-term; E. Long-term memory in NORT for the sham group and rats received vehicle (control), curcumin 50 mg/kg (CUR50), or curcumin 100mg/kg (CUR100) for 28 days after GCI
*P<0.05; **P<0.01; ***P<0.001 significantly different from the control group
#P<0.05; ##P<0.01; ###P<0.001 significantly different from the sham group

