
Figure 9.3.
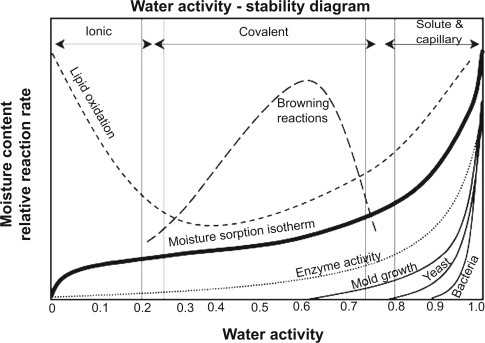
Global water activity-stability diagram or moisture-sorption isotherm (water activity is along the horizontal axis, while moisture content or reaction rate is plotted along the vertical axis).
Official websites use .gov
A
.gov website belongs to an official
government organization in the United States.
Secure .gov websites use HTTPS
A lock (
) or https:// means you've safely
connected to the .gov website. Share sensitive
information only on official, secure websites.
Global water activity-stability diagram or moisture-sorption isotherm (water activity is along the horizontal axis, while moisture content or reaction rate is plotted along the vertical axis).