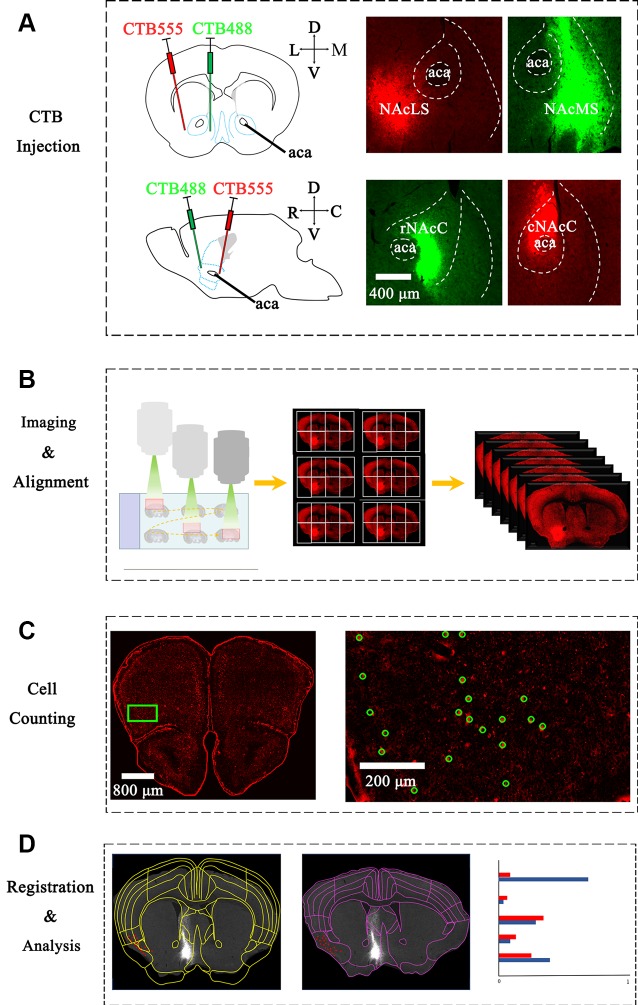
Figure 1.
Experimental strategy for identification of inputs to different nucleus accumbens (NAc) subregions. (A) Upper panel: left, schematic injection site in NAcS; middle, representative coronal brain sections near CTB-conjugated Alexa Fluor 555 (CTB-555) (red) injection sites in lateral shell segments (NAcLS); Right, representative coronal brain sections near CTB-488 (green) injection sites in medial shell segments (NAcMS). Lower panel: Left, schematic injection site in NAc core (NAcC); middle, representative coronal brain sections near CTB-488 (green) injection sites in rNAcC; right, representative coronal brain sections near CTB-555 (red) injection sites in Caudal nucleus accumbens core (cNAcC). (B) The scheme of imaging serial sections by an automated slice scanning microscope. Manual alignment of whole-brain serial images along the rostral-caudal axis. (C) Manual counting of CTB-labeled neurons of each slice using ImageJ. Green circles marked neurons labeled by CTB-555. (D) Left, registration of Allen Atlas regions to one section; middle, manual adjustment to fit atlas segmentation to the image. Note that the adjusted segmentation resulted in the different categorization of individual cell bodies (red dot). Right: schematic of statistical analysis of WholeBrain data.

