Figure 3.
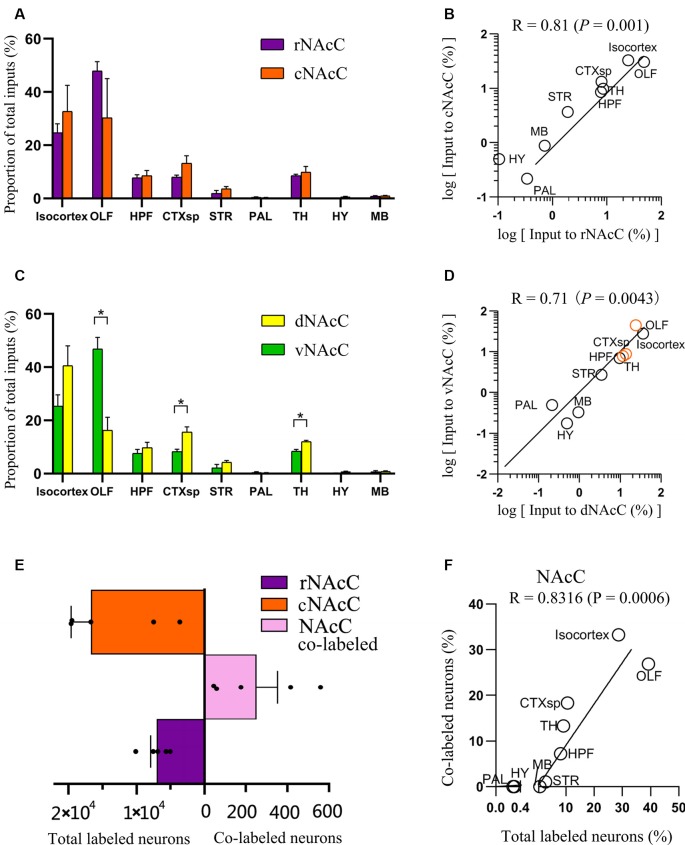
Overview of whole-brain inputs to subdomains of NAcC. (A) Distribution of input neurons of rNAcC and cNAcC across nine major brain areas [two-way analysis of variance (ANOVA), n = 5 mice for rNAcC and cNAcC]. (B) Correlation of the distributions of inputs neuron of rNAcC and cNAcC across nine major brain areas. (C) Distribution of input neurons of dNAcC and vNAcC across nine major brain areas (two-way ANOVA, n = 4 mice for dNAcC and vNAcC). (D) Correlation of the distributions of inputs neuron of dNAcC and vNAcC across nine major brain areas. The brain areas containing significantly different proportions of the input neurons projecting to two NAcC subdomains were highlighted as orange circles. (E) The number of total and co-labeled input neurons of rNAcC and cNAcC. (F) Correlation of fraction of co-labeled input neuron in each area and the proportion of input neurons contributed by such brain area to the total inputs to NAcC. *P < 0.05.

