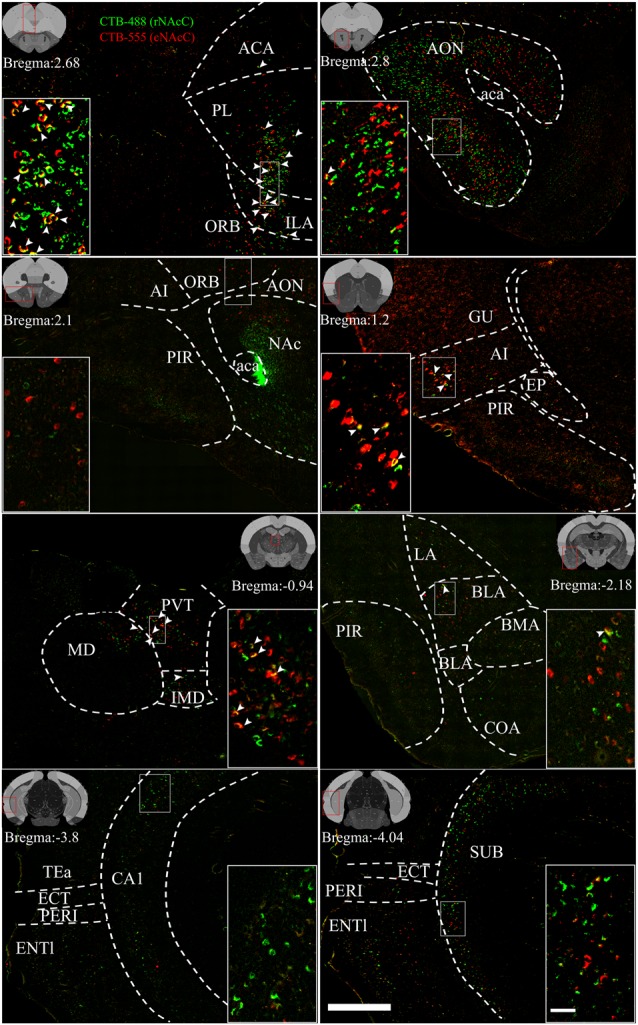
Figure 4.

Reprehensive images of input neurons of NAcC subdomains. Representative coronal sections showing CTB-labeled inputs to rNAcC (green) and cNAcC (red). The region in the white box is shown at a higher resolution in the inset. The location of each section is indicated by the red box in the atlas template image (gray) in the upper left or upper right corner. Scale bar = 400 μm, 50 μm (inset).
