
Figure 9.
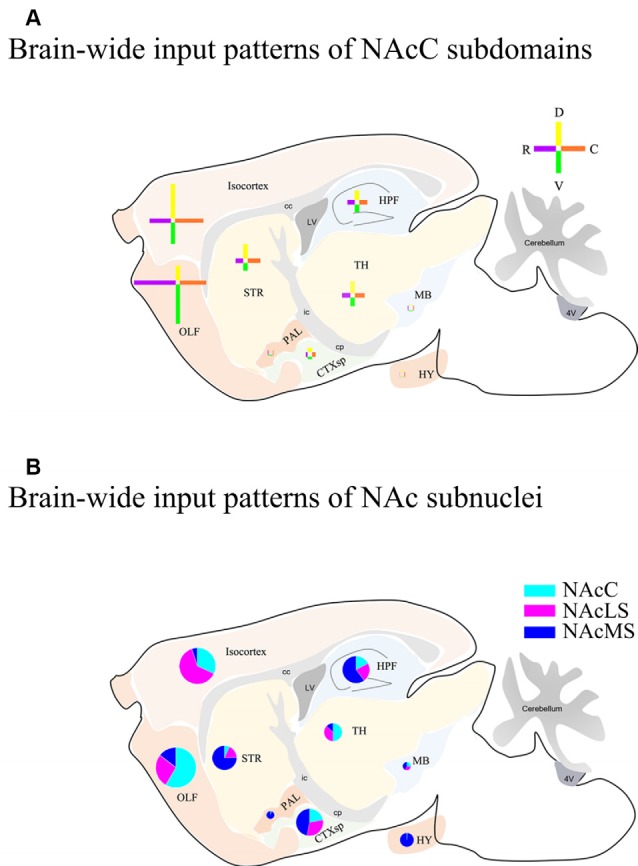
Schemes of brain-wide input patterns of NAcC and NAcS subdomain. (A) Brain-wide input patterns of NAcC subdomains. Each cross indicates inputs to NAcC subdomains from corresponding major brain areas and the arm length indicates the relative amount of input neurons in the corresponding major brain area. The horizontal arm shows the relative input amount of rNAcC (purple) and cNAcC (orange), and the vertical arm shows the relative amount of input neurons of dNAcC (yellow) and vNAcC (green). (B) Brain-wide input patterns of NAcLS, NAcMS, and NAcC. Every pie indicates the relative amount of input neurons of NAc subnuclei from the corresponding major brain area.