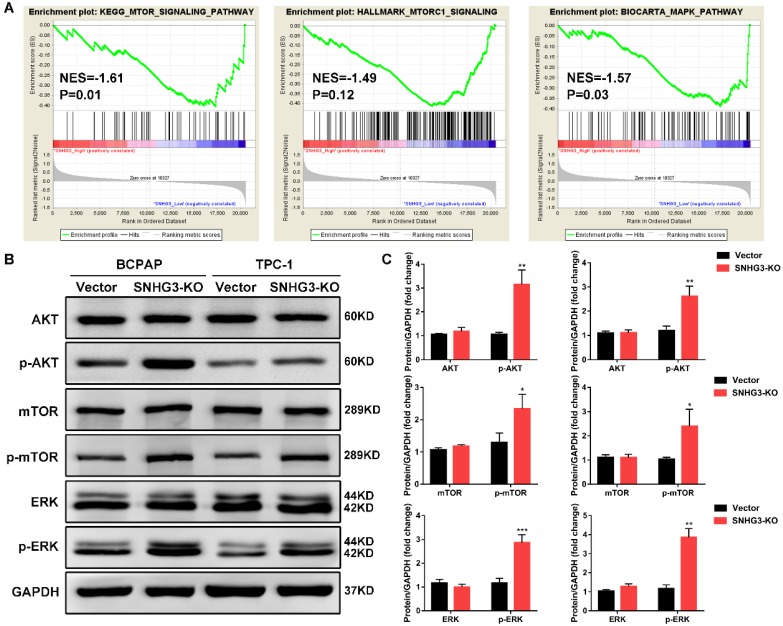
Figure 4.
Bioinformatic analysis reveals that SNHG3 was involved in the AKT/mTOR/ERK pathway. (A) GSEA analysis comparing the SNHG3-high (red) and low (blue) expression subgroups of PTC patients in the TCGA dataset. Enrichment plots indicate hallmark gene sets enriched in SNHG3-low PTC patients. (B) Western blot analysis for mTOR, mTOR (Ser2481), AKT, AKT (Ser473), ERK and ERK (Thr202/Tyr204) in SNHG3 knockout and control group of BCPAP and TPC-1 cells. (C) The densitometric analysis of the western blot bands shown in Fig. 4B. The gray values are expressed as the mean ± SD from three independent experiments. *P < 0.05, **P < 0.01, ***P < 0.001.

