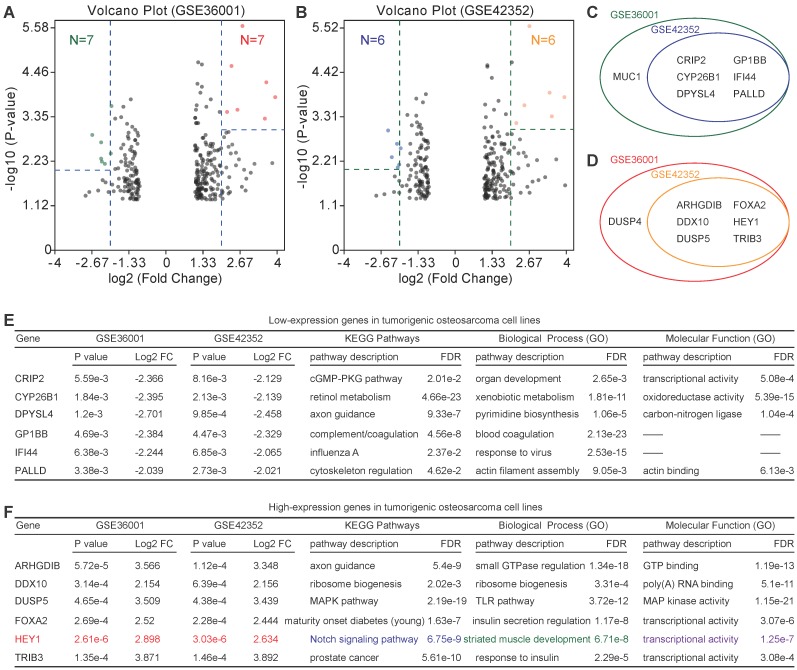
Figure 4.
Identification of candidate lowly expressed and highly expressed genes. (A) & (B) Volcano plot of candidate lowly expressed and highly expressed genes. (C) & (D) Lowly and highly expressed genes. e Function enrichment of lowly expressed genes. f Function enrichment of highly expressed genes. Log2 FC: Log2 fold change; FDR: False discovery rate.

