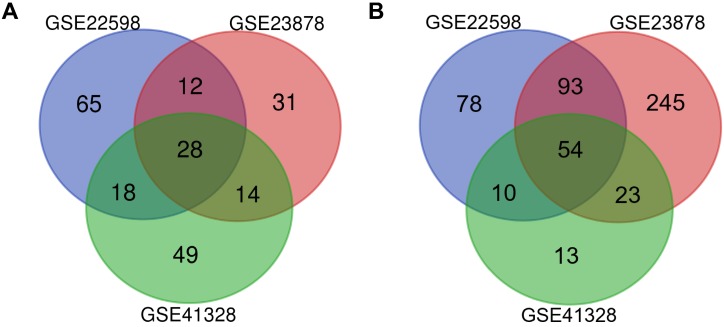
Figure 1.
Identification of differentially expressed genes in CRC. Draw Venn Diagram (http://bioinformatics.psb.ugent.be/webtools/Venn/) was used to identify DEGs among three cohort profile datasets (GSE22598, GSE23878, and GSE41328). The 28 upregulated genes (A) and 54 downregulated genes (B) in the CRC datasets were showed. The DEGs were identified with the classical t-test, and statistically significant DEGs were defined with P < 0.01 and [logFC] > 2 as the cutoff criteria.

