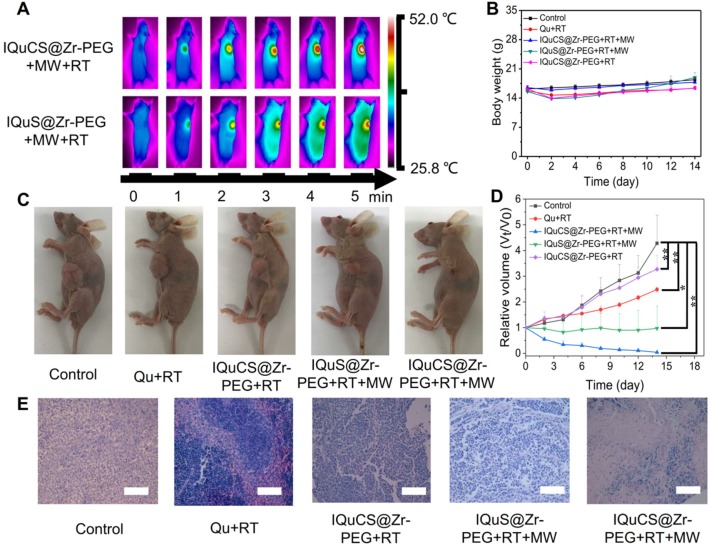
Figure 4.
Evaluation of in vivo treatment experiments of the IQuCS@Zr-PEG NSPs. (A) FLIR map of mice in the IQuCS@Zr-PEG+RT+MW group and the IQuS@Zr-PEG+RT+MW group after MW irradiation per minute. (B) Body weight changes every two days during the 14 days of treatment in each mouse. (C) After 14 days, the mice were sacrificed, and the residual condition of the tumor after treatment in each group of mice. (D) The relative tumor volumes (Vt/V0) of each mouse within 14 days after treatment. (E) H&E stained sections of the tumor tissues were treated for 14 days after treatment in each group. The scale bar is 50 µm. Analysis of statistical (n=4, * indicates P < 0.05, ** indicates P < 0.01 and *** indicates P < 0.001).

