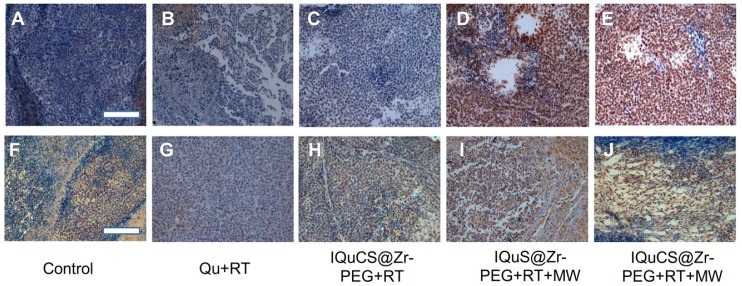
Figure 5.
Experimental results of TUNEL and immunohistochemistry. (A-E) Figures A to E were the TUNEL results of the tumor tissues in the control group, Qu+RT group, IQuCS@Zr-PEG+RT group, IQuS@Zr-PEG+RT+MW group, and IQuCS@Zr-PEG+RT+MW group, respectively (magnification 200×). (F-J) Figures F to J were the immunohistochemistry results of the tumor tissues in the control group, Qu+RT group, IQuCS@Zr-PEG+RT group, IQuS@Zr-PEG+RT+MW group, and IQuCS@Zr-PEG+RT+MW group, respectively (magnification 200×). The scale bar is 50 µm.

