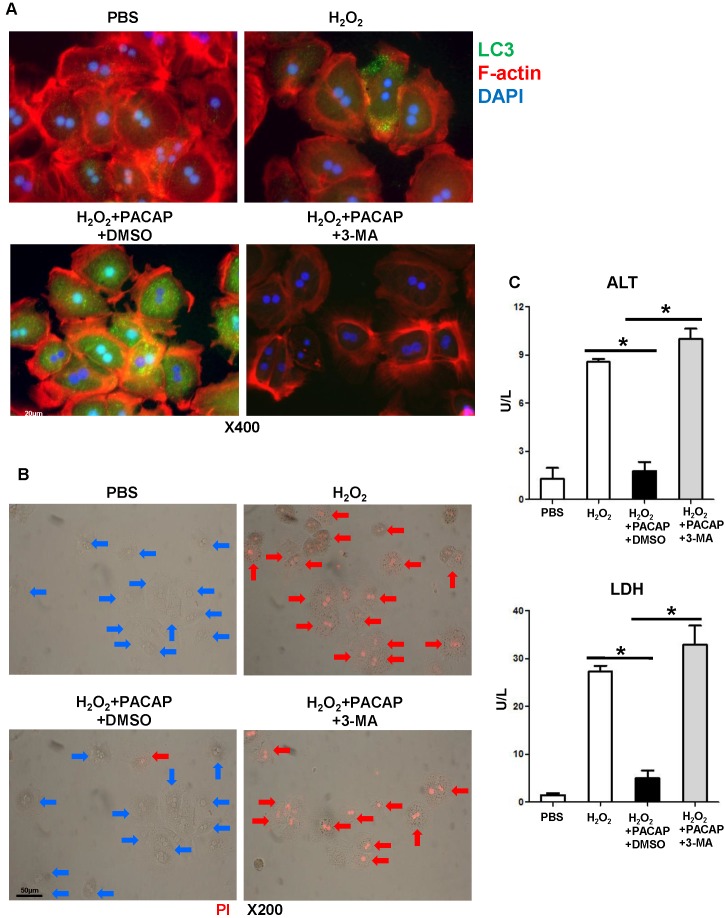
Figure 2.
PACAP-mediated hepatocellular autophagy in vitro. Primary hepatocytes were pre-treated with PACAP+DMSO, or PACAP+3-MA 1 h prior to H2O2 stress. (A) Representative immunofluorescence staining: LC3 (green), cellular skeleton (F-actin, red) and nuclear (DAPI, blue): LC3 accumulation in cytoplasm and nucleus (magnification: x400, scale bar represents 20µm); (B) PI staining: red fluorescence images (PI stained nuclear of dead cells) were merged with brightfield images: live cells (blue arrows) and dead cells (red arrows) (magnification: x200, scale bar represents 50µm); (C) supernatant ALT/LDH levels (*p<0.001, n=6/group).

