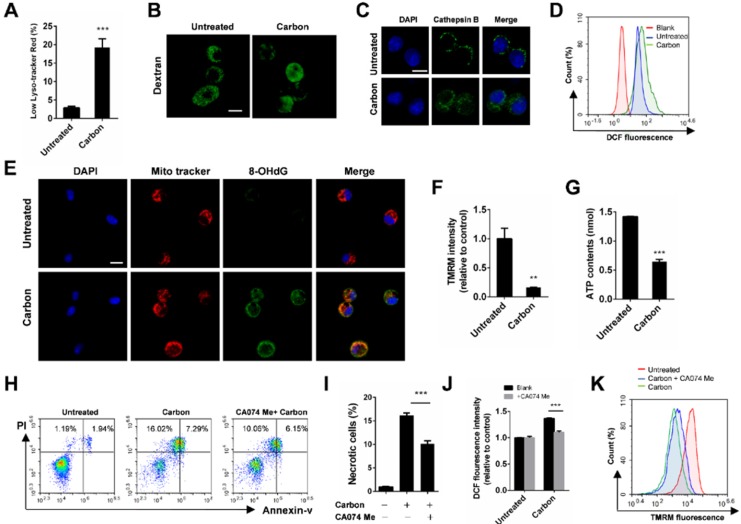
Figure 4.
CBNP-induced cell necrosis is associated with lysosomal membrane permeabilization. (A) The fluorescence intensity of lysotracker-red in MH-S cells was detected by flow cytometry after treatment with CBNPs (100 µg/cm2) for 30 min. (B) MH-S cells were pre-loaded with 20-kDa FITC-conjugated dextran, and then treated with CBNPs (25 µg/cm2) for 2 h. (C) alveolar macrophages were treated with CBNPs (25 µg/cm2) for 2 h and then detected with mouse anti-mouse cathepsin B antibody. (D) The intracellular ROS levels were detected by flow cytometry after treatment with CBNPs (100 µg/cm2) for 30 min. (E) Mitochondrial DNA oxidative damage was detected by colocalization staining of Mito Tracker and 8-OHdG. (F-G) MH-S cells were incubated with CBNPs (100 µg/cm2) for 30 min. The mitochondrial membrane potential was measured with TMRM (F) and the cellular ATP levels (G) were detected with kits. (H-K) MH-S cells were pre-treated with CA074 Me (100 µM) for 30 min before stimulation and then treated with CBNPs (100 µg/cm2) for 30 min. The necrotic cells (H-I) were detected by flow cytometry. (J) Intracellular ROS levels were detected. (K) TMRM fluorescence intensity was detected. Scale bar = 10 µm. Data are mean ± SEM; n = 3 per group, **P < 0.01, ***P < 0.001 compared with the control group by Student's t-test

