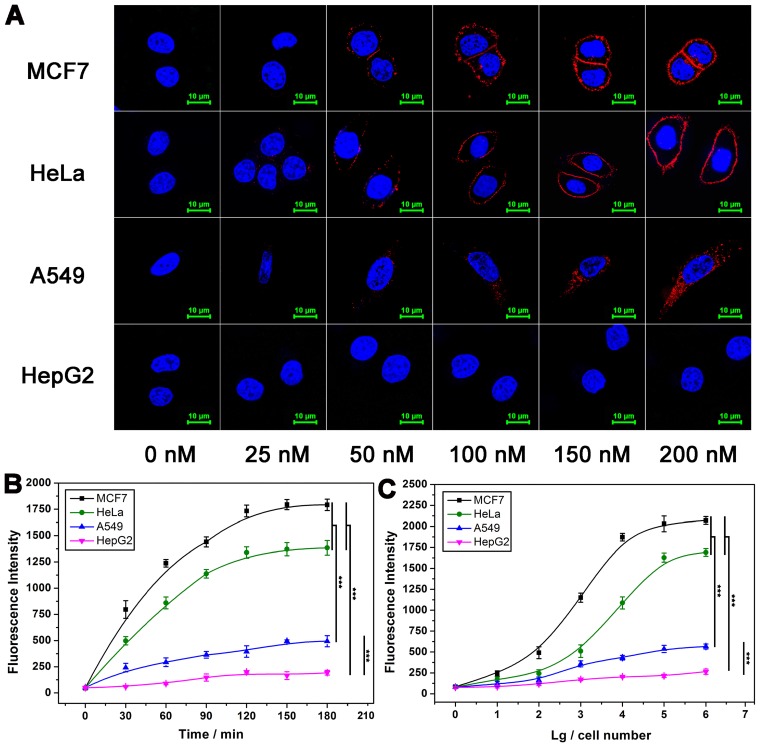
Figure 2.
Effect of some conditions on the performance of DTA analysis. (A) Confocal laser scanning microscope images of MUC1 after cells were incubated with different concentrations of Cy5-labeled Apt-Pri. (B) Optimization of polymerase amplification time of DTA analysis by monitoring the fluorescence intensity of FAM-labeled molecular beacon that were released into the supernatant after the DTA analysis. Ex: 488 nm, Em: 520 nm. (C) Fluorescence quantitative signals of MUC1 with various cell numbers. The signals were also obtained from FAM-labeled molecular beacon. The data represent the mean ± SD (error bars) of triplicate experiments. N.S., no significance. *, p<0.05. **, p<0.01. ***, p<0.001.

