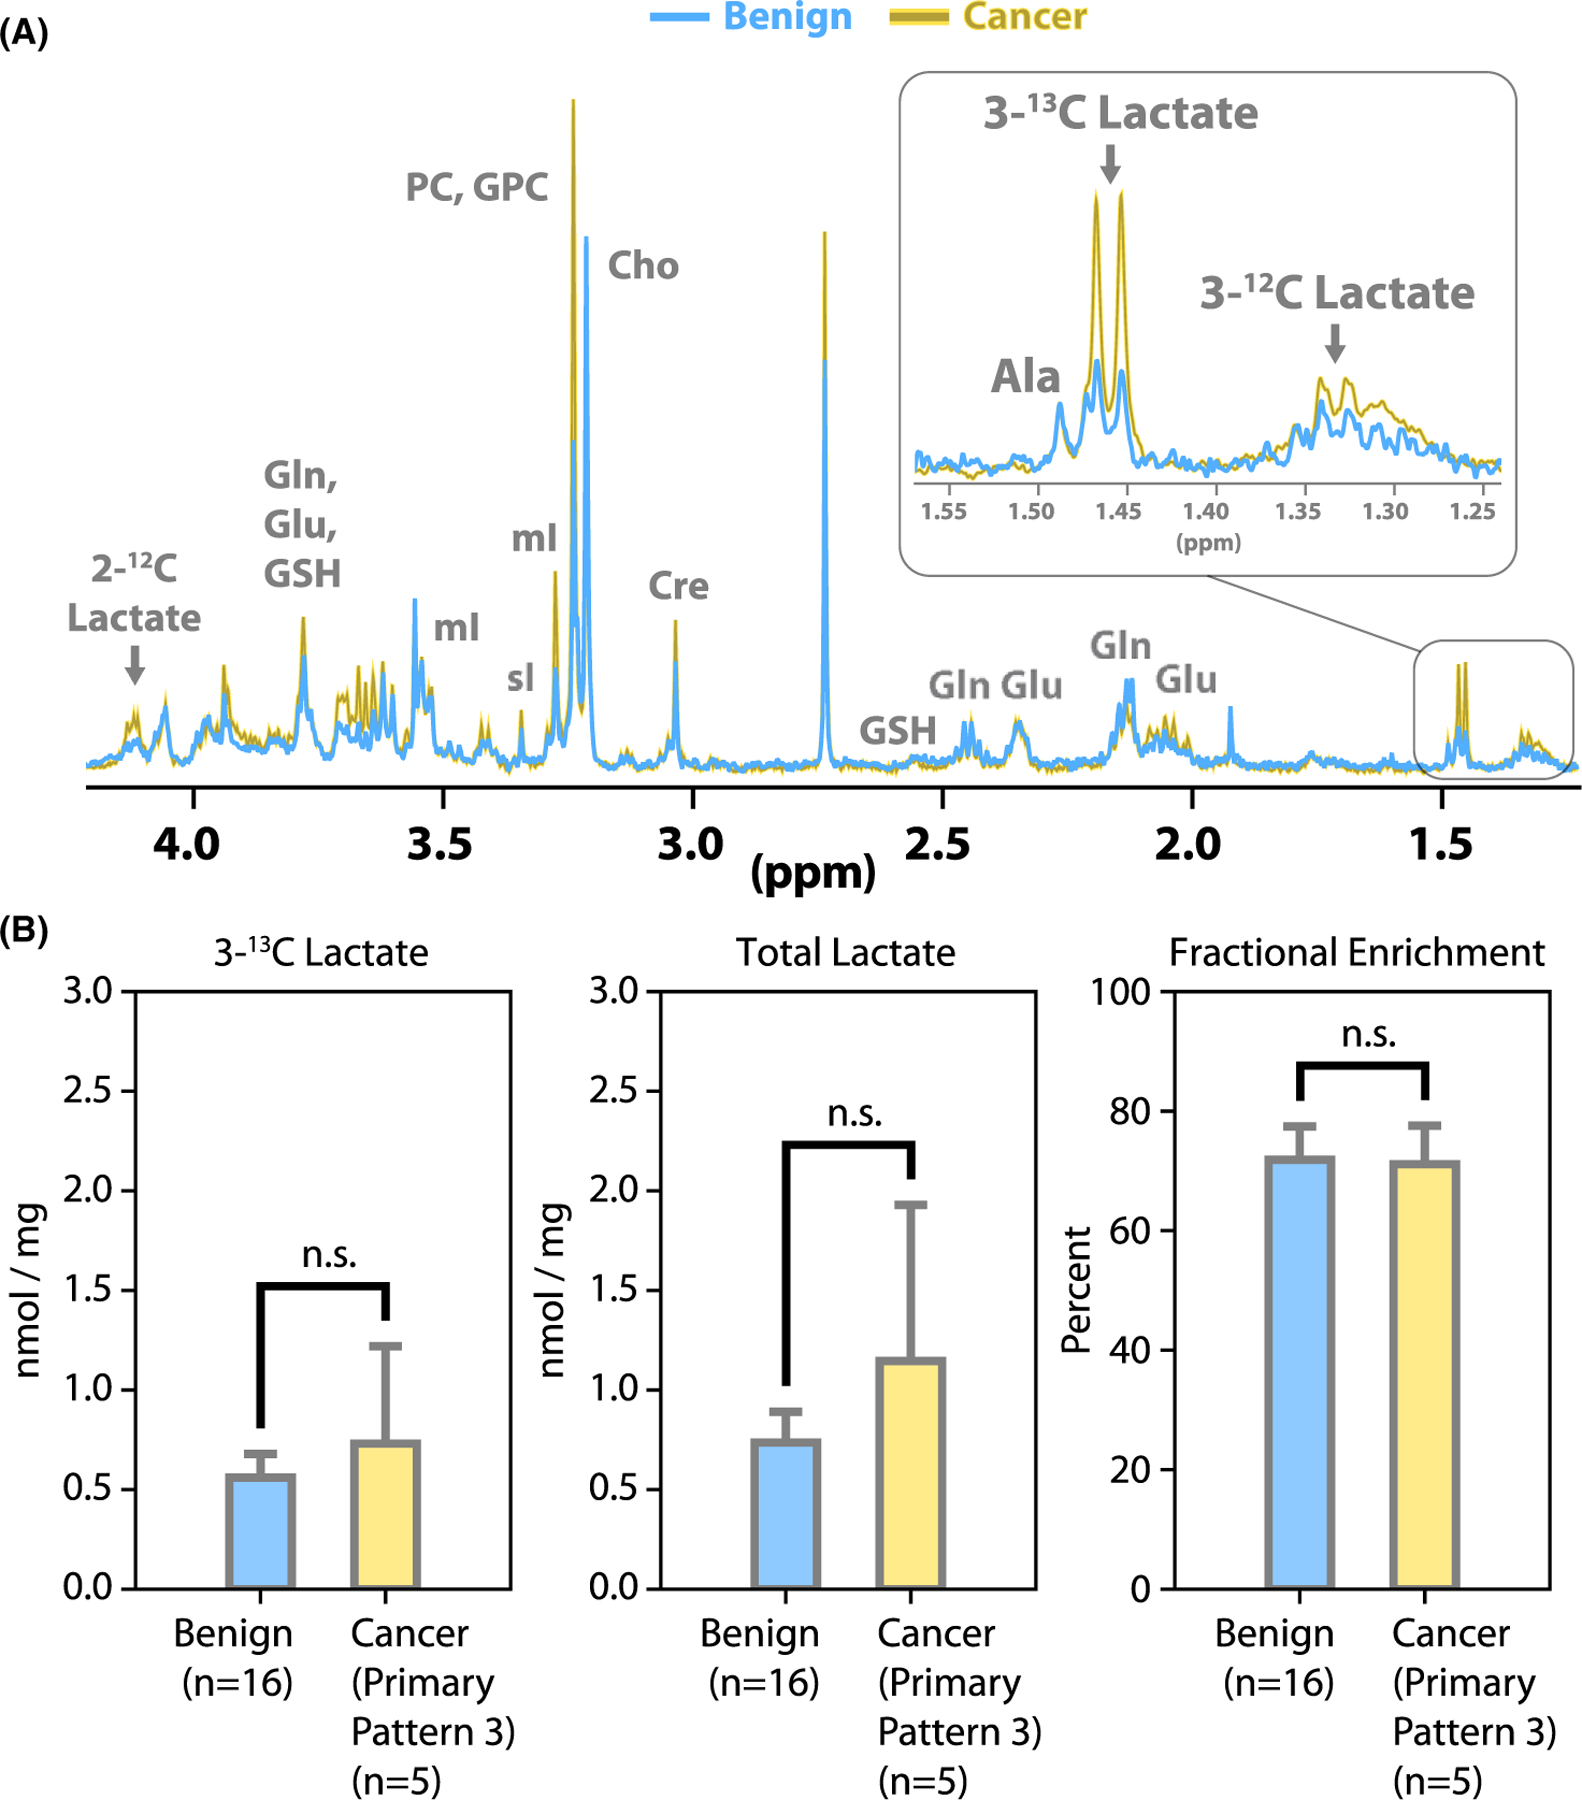
FIGURE 4.

Biopsy tissue HR-MAS spectra. (A) Examples of CPMG spectra from benign (blue) and cancer (yellow) samples after culture. The [2-12C]lactate peak is visible at left, as a quartet split by the long-range coupling (~4 Hz) to [3-13C]lactate. Ala, alanine; Glu, glutamate; Gln, glutamine; GSH, glutathione; Cre, creatine; Cho, choline; PC, phosphocholine; GPC, glycerophosphocholine; mI, myo-inositol; sI, scyllo-inositol. (B) Quantified CPMG data: [3-13C]lactate concentration, total lactate concentration and fractional enrichment of lactate at the 3-position
