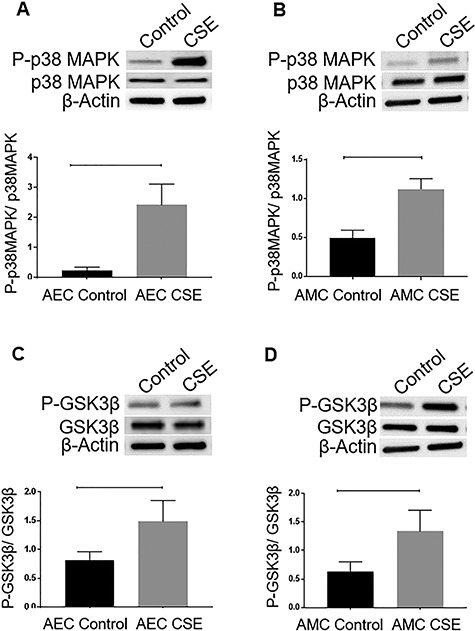
Figure 2.

Effect of CSE on p38MAPK and GSK3β expression in the amnion membrane. (A and B) WBs of AECs and AMCs for P-p38MAPK in response to CSE treatment. (C and D) WBs of P-GSK3β in AECs and AMCs in response to CSE treatment. The relative levels of P-p38MAPK and P-GSK3β significantly increased in response to CSE treatment compared to controls in both AECs (P = 0.005 and P = 0.05, respectively) and AMCs (P = 0.009 and P = 0.04 respectively). Total p38MAPK and total GSK3β were used for normalization. Representative blots from a minimum n = 3 for each cell type are shown. Data are presented as mean ± SEM.
