
Figure 5.
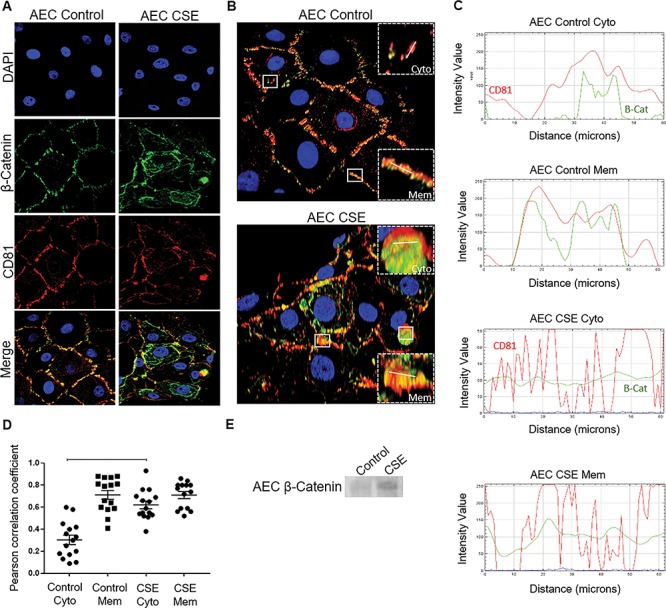
Fate of β-Cat in AECs. (A) Confocal microscopy of control and CSE-treated AECs showing β-Cat (green) and CD81 (red) localization. CSE treatment induced cytoplasmic β-Cat and CD81 compared to controls. (B) Three dimensional confocal images highlighting membrane (Mem) and cytoplasmic (Cyto) region of interest (crops; n = 15) selected for co-localization analysis. Control AEC (top) and CSE-treated AEC (bottom). White lines represent 60 μM line graph region of interest. DAPI—nuclear stain (blue); β-Cat (green); CD81—exosome marker (red). (C) The line graphs demonstrate overlap between CD81 and β-Cat signal at the region of interest at the cytoplasm (Cyto) and membranes (Mem) of both control and CSE-treated AECs. CSE exosomes contained more β-Cat-CD81 overlap than control exosomes. (D) The Pearson’s correlation coefficient showed significantly higher co-localization at the regions of interest in the cytoplasm of CSE-treated AECS compared to controls (P < 0.0001). Data are presented as mean ± SEM. (E) WB analysis of relative levels of β-Cat within AEC exosomes. Representative blot from a minimum of n = 3 is shown. Oxidative stress increased β-Cat in exosomes compared to exosomes from cells grown under normal conditions.