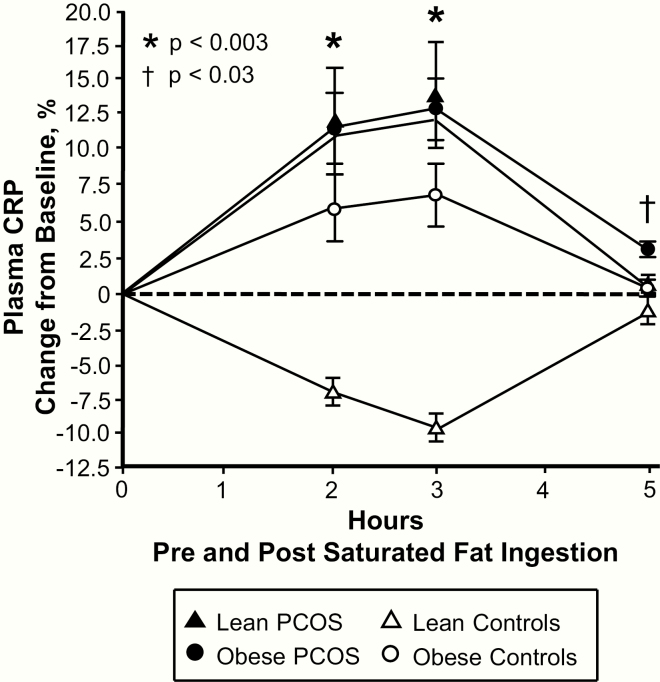
Figure 4.
Comparison of the 4 study groups of the change from baseline (%) in plasma C-reactive protein (CRP) blood samples collected while fasting and 2, 3, and 5 h after saturated fat ingestion. Data are presented as mean ± standard error. *Response in women with PCOS and obesity, lean women with PCOS, and control subjects with obesity was significantly different compared with lean control subjects; P < .003. †Residual response in women with PCOS and obesity was significantly different compared with the other three groups; P < .03.

