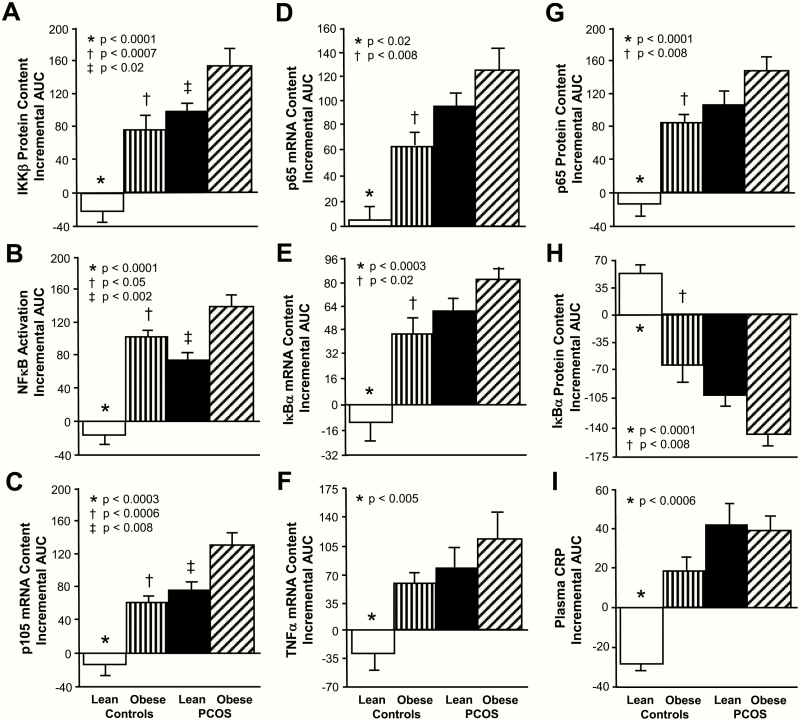
Figure 5.
Comparison of the 4 study groups of the incremental area under the curve (iAUC) in response to saturated fat ingestion for mononuclear cell (MNC)-derived (A) inhibitory κB kinase-β (IKKβ) protein content, (B) activated nuclear factor κB (NFκB) (C) p105, (D) p65, (E) inhibitory κBα (IκBα) and (F) TNFα mRNA content, (G) p65 and (H) IκBα protein content, and (I) plasma C-reactive protein (CRP) levels. Data are presented as mean ± standard error. *The iAUC in lean control subjects was significantly different compared with the other 3 groups; (A, B, E, G, and H) P < .0001, (C) P < .0003, (D) P < .02, (F) P < .0003, (F) P < .005, and (I) P < .0006. †The iAUC in control subjects with obesity was significantly different compared with women with PCOS and obesity; (A) P < .0007, (B) P < .05, (C, D, G, and H) P < .008, and (E) P < .02. ‡The iAUC in lean women with PCOS was significantly different compared with women with PCOS and obesity; (A) P < .02, (B) P < .002, and (C) P < .008.

