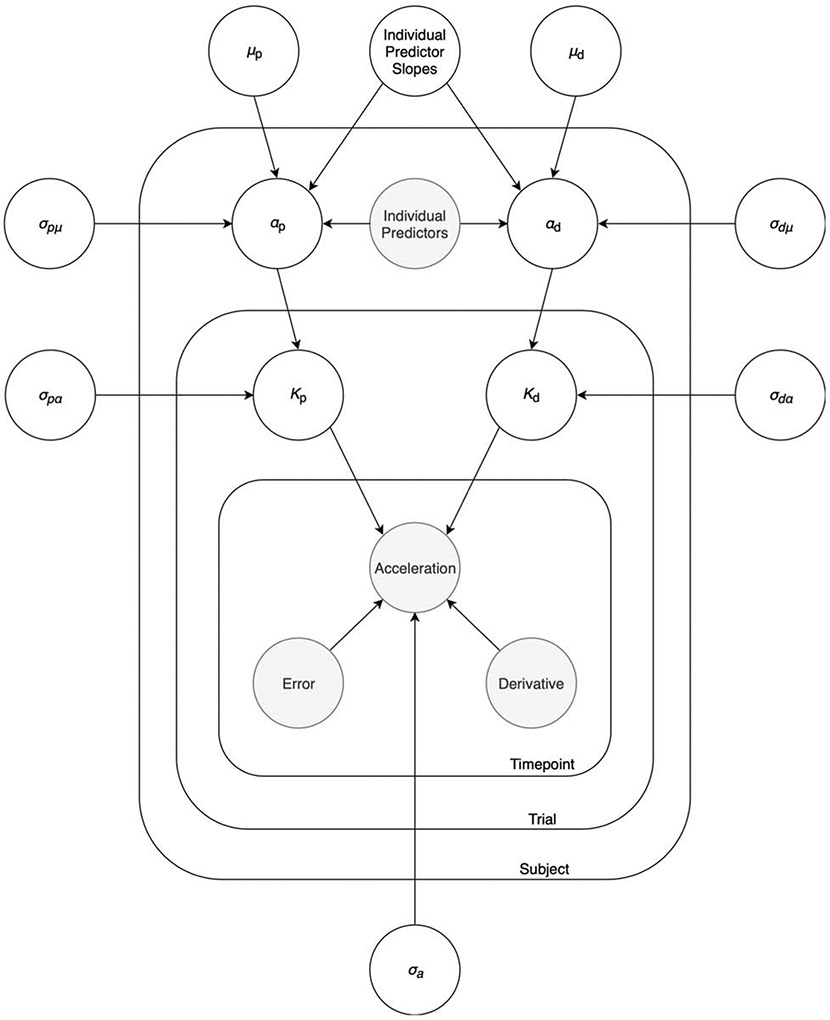
Figure 2:
Hierarchical Bayesian model. The graphical model depicts the hierarchical PD control modeling approach. Shaded circles represent data, while non-shaded circles represent parameters. At each timepoint within a trial, acceleration depends on error and derivative of the error according to the PD control model. Kp and Kd for each trial represent the coefficients of the error term and derivative term, respectively. Trial-level Kp and Kd are drawn from subject-level means (αp and αd), which themselves are drawn from group-level means (μp, and μd). Depending on the particular model, αp and αd can be related to individual-level predictors such as self-report scores, demographics, and brain region volumes. The σ terms represent standard deviations. See Methods section for details of the modeling approach.

