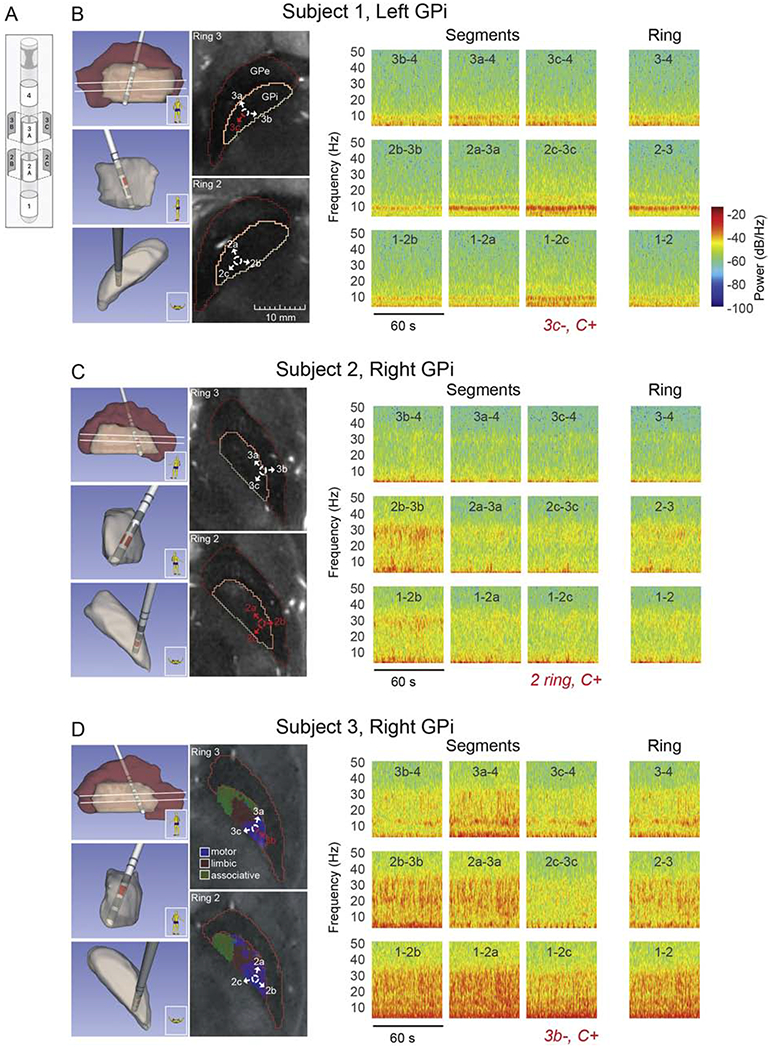
Figure 1. DBS Lead locations and Local Field Potential Topography. [Color; 2-column fitting].

Local field potential recordings in the pallidum of three DBS patients using directional DBS leads. (A) Schematic of Abbott Infinity DBS segmented lead (image courtesy Abbott). (B) (left panel) Lead and pallidal reconstruction based on pre-operative 7T MRI and post-operative CT scans for subject 1. Sagittal, coronal, and axial views of 3-D reconstructions are shown (top to bottom, respectively). Two axial MRI slices at the levels of segmented contacts (rings 2 and 3, white lines in sagittal 3-D reconstruction) are also shown along with identification of GPi and GPe borders. Labeled arrows corresponding to contact segments have been added to aid visualization of lead orientation. All axial MRI images in panels (B-D) are presented at the same size scale, (right panel) Spectrograms over 60 seconds of spontaneous, resting state LFP activity, comparing directional sensing using segments and ring recordings. The DBS montage selected in clinic during the patient’s initial programming visit is shown in red italics. For example ‘3c−, C+’ is monopolar stimulation configuration with segment 3c as the cathode and the battery case as the anode. These settings were chosen by the movement disorder clinician per their standard of care and were blinded to the physiological recordings presented here. Active segments are also indicated in red in lead location reconstructions and axial MR images. (C,D) Same as in panel B, for subjects 2 and 3, respectively. The axial MRI slices in panel D also include parcellations of motor (blue), associative (green), and limbic (red) territories estimated based on 7T diffusion MRI scans collected in this subject.
