
Figure 3. Resting State and Reach Task Spectrogram Plots. [color; 2 column-fitting].
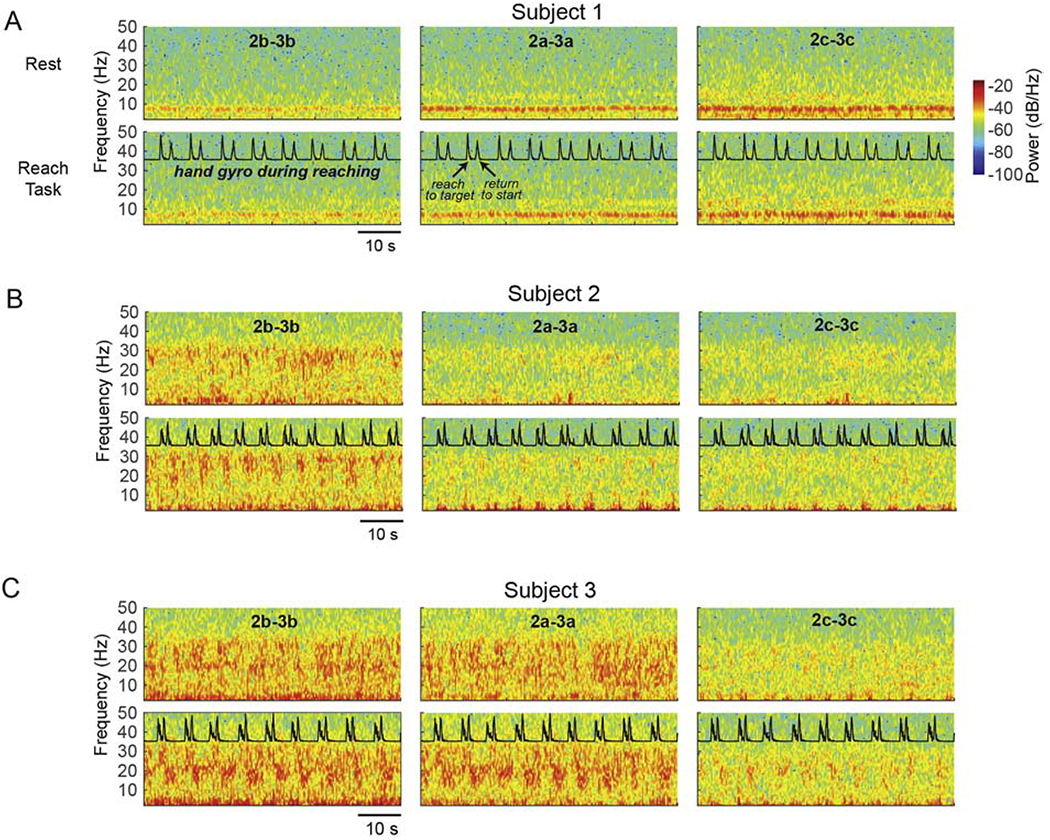
Reach task-related changes in oscillatory activity in the GPi. (A) Spectrograms over 60 seconds in two conditions in subject 1: rest (top row), touchscreen reaching task (second row; normalized gyroscope trace collected from a Delsys IMU sensor is overlaid). Each column represents a bipolar configuration using the vertically adjacent segments of rings 2 and 3 (e.g. 2a-3a), with the same behavioral data overlaid in each column for visualization. (B,C) Same as in (A) for subjects 2 and 3, respectively. All plots have the same color scale as in panel (A).