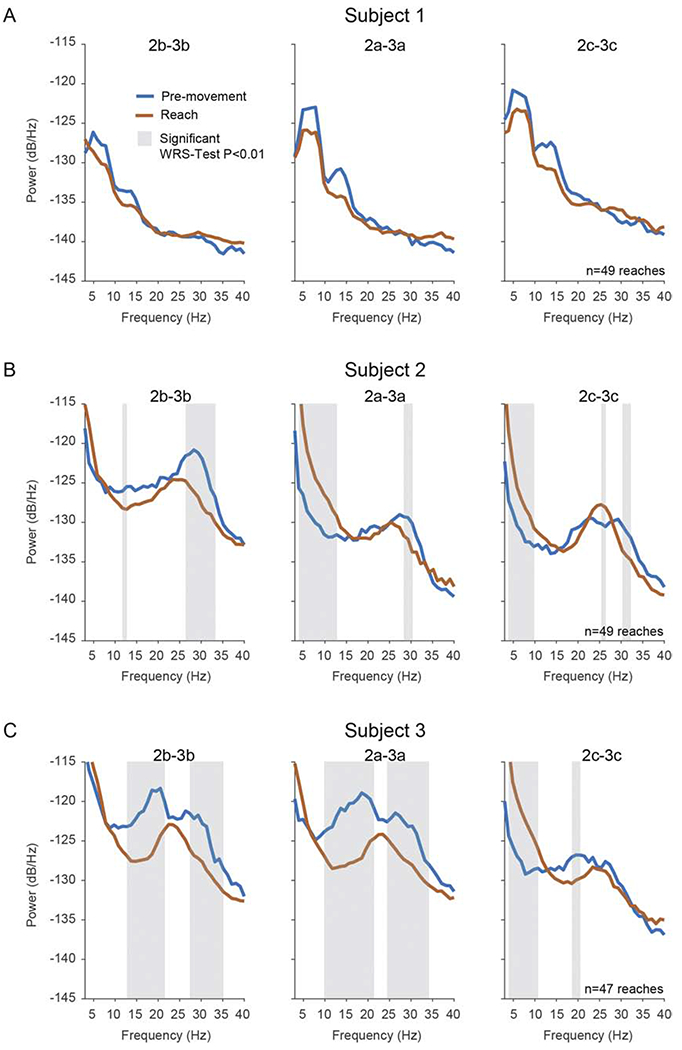
Figure 4. Power Spectral Density Plots of Resting State Compared to Reach Task. [color; 1.5 column-fitting].

The effects of movement on spectral power in the 3-40Hz range in the GPi (A) Median PSDs in pre-movement and reach conditions in subject 1. Reach PSDs were calculated during a time period centered at maximal reach velocity (see Methods); pre-movement PSDs were calculated from a time period prior to reaching while the patient maintained a resting position on the startpad. Each column represents a bipolar configuration using the vertically adjacent segments of ring 2 and 3 (e.g. 2a-3a). Shaded regions indicate significant differences between PSDs based on the Wilcoxon rank-sum (WRS) test (p=0.01) corrected for multiple comparisons. Two consecutive bins had to pass the WRS-test for a difference to be considered significant.
