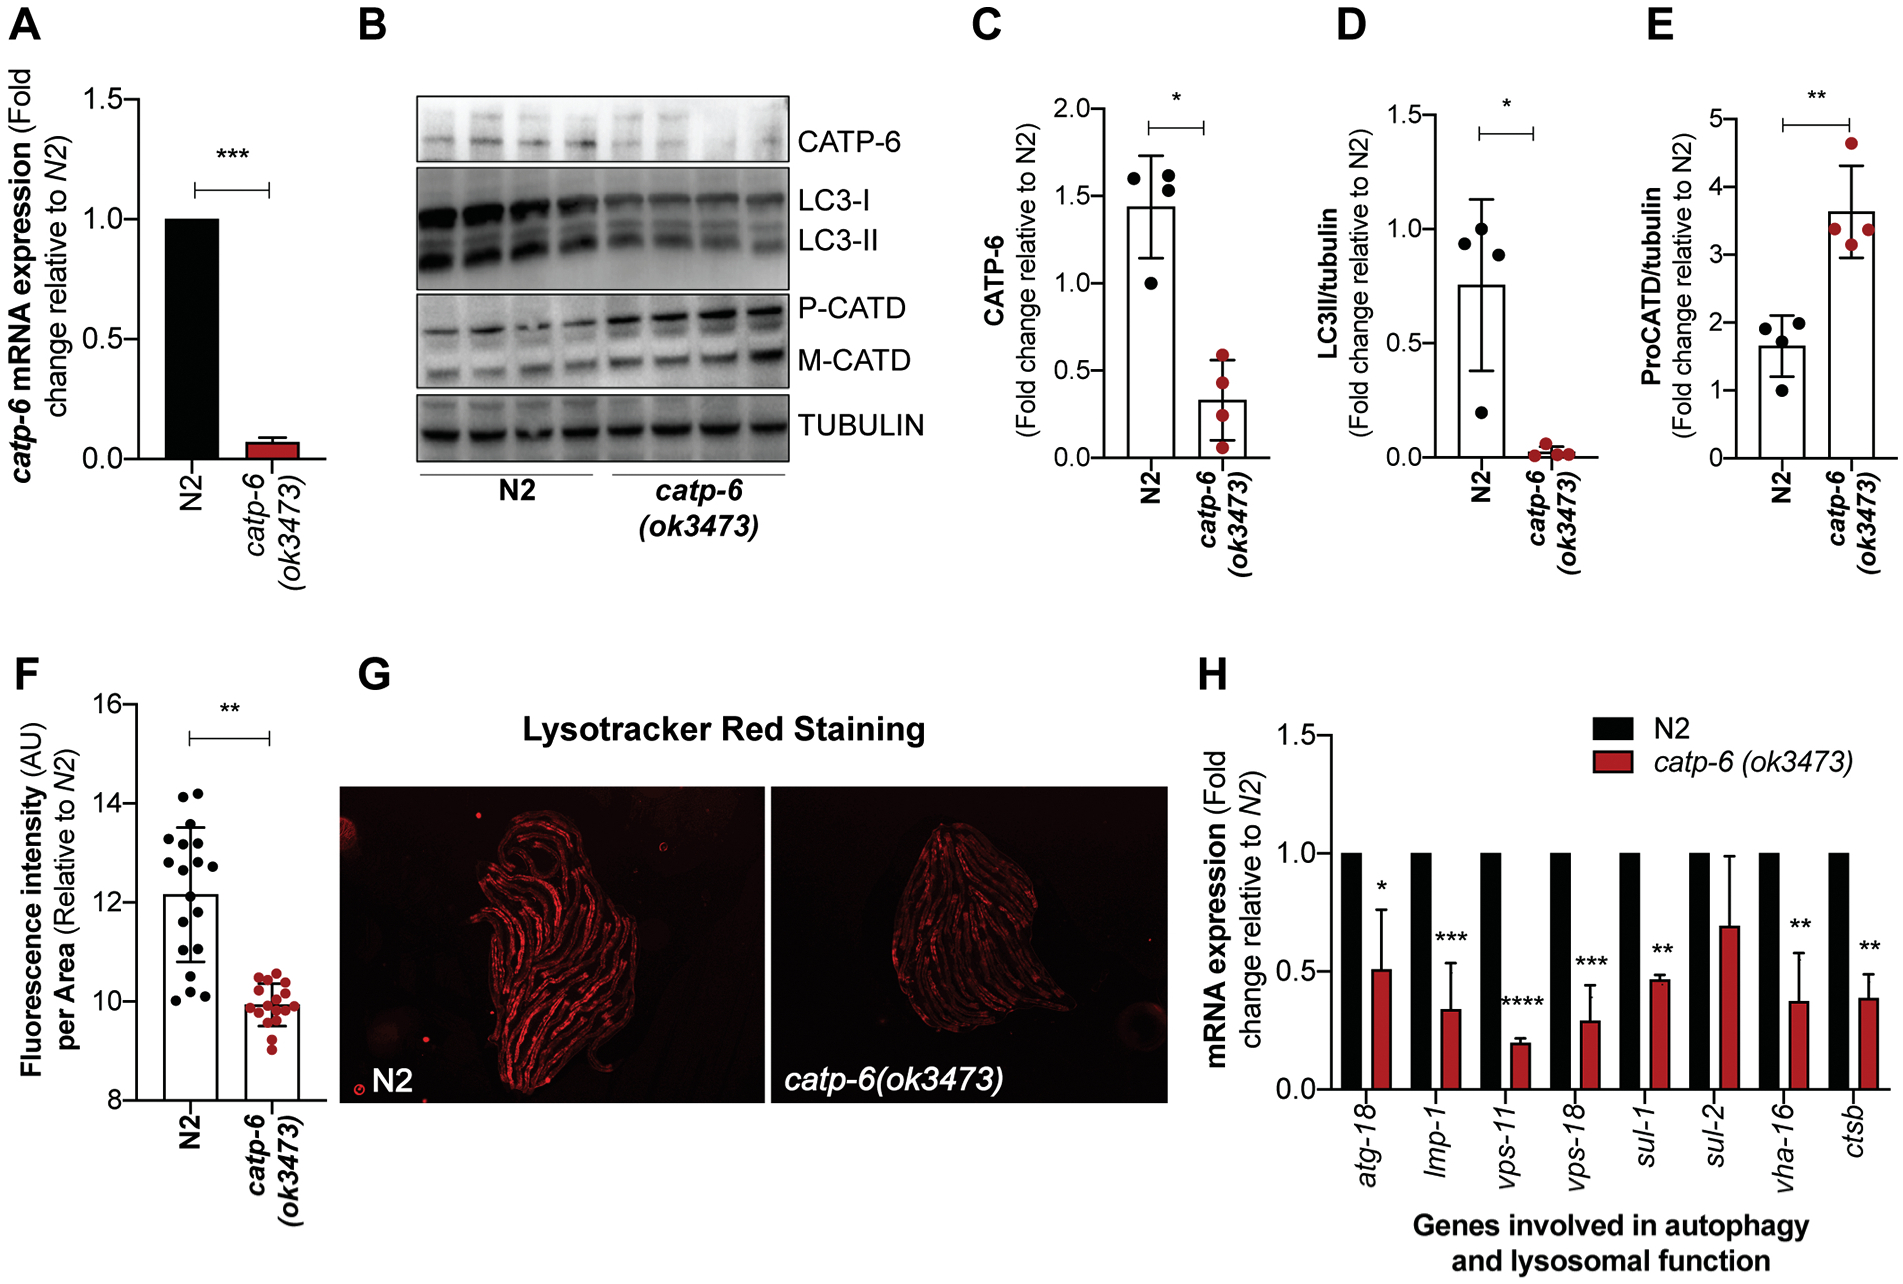
Figure 1: Loss of catp-6 affects autophagy and lysosomal function in C. elegans.

(A) Graph represents fold change ± SD in the mRNA expression of catp-6 in catp-6(ok3473) mutant relative to wild type N2 worms (n=2, p-values calculated using unpaired Student’s t-test). (B) Immunoblot showing the level of CATP-6, autophagosome specific cleaved LGG-1/LC3-II protein and lysosome specific aspartyl protease ASP-3/cathepsin D (CATD) which exists as procathepsin D (P) and mature (M) cathepsin D and loading control γ-tubulin. (C-E) Graph represents the densitometric analysis of the bands, showing average band intensity ± SD of CATP-6, cleaved LGG-1/LC3-II and P-CATD normalized to loading control γ-tubulin (n=4, p-values calculated using unpaired Student’s t-test) (F) Graph represents the mean fluorescence intensity ± SD of LysoTracker Red stain normalized to the body size for wild type N2 and catp-6(ok3473) worms. Quantification was performed on the whole body of an individual worm using NIH image J software (n=2, p-values calculated using unpaired Student’s t-test). (G) Representative images of the N2 and catp-6(ok3473) worms showing LysoTracker red fluorescence. (H) Graph represents fold change ± SD in the mRNA expression of autophagy and lysosomal specific genes in catp-6(ok3473) mutant worms relative to wild type N2 worms (n=2, p-values calculated using ordinary two-way ANOVA by Multiple t-tests with correction for multiple comparisons using the Holm-Sidak method). All the p-values are represented as *p < 0.05, **p<0.01 ***p<0.001 and ****p<0.0001.
