
Figure 1.: Calendar age distributions.
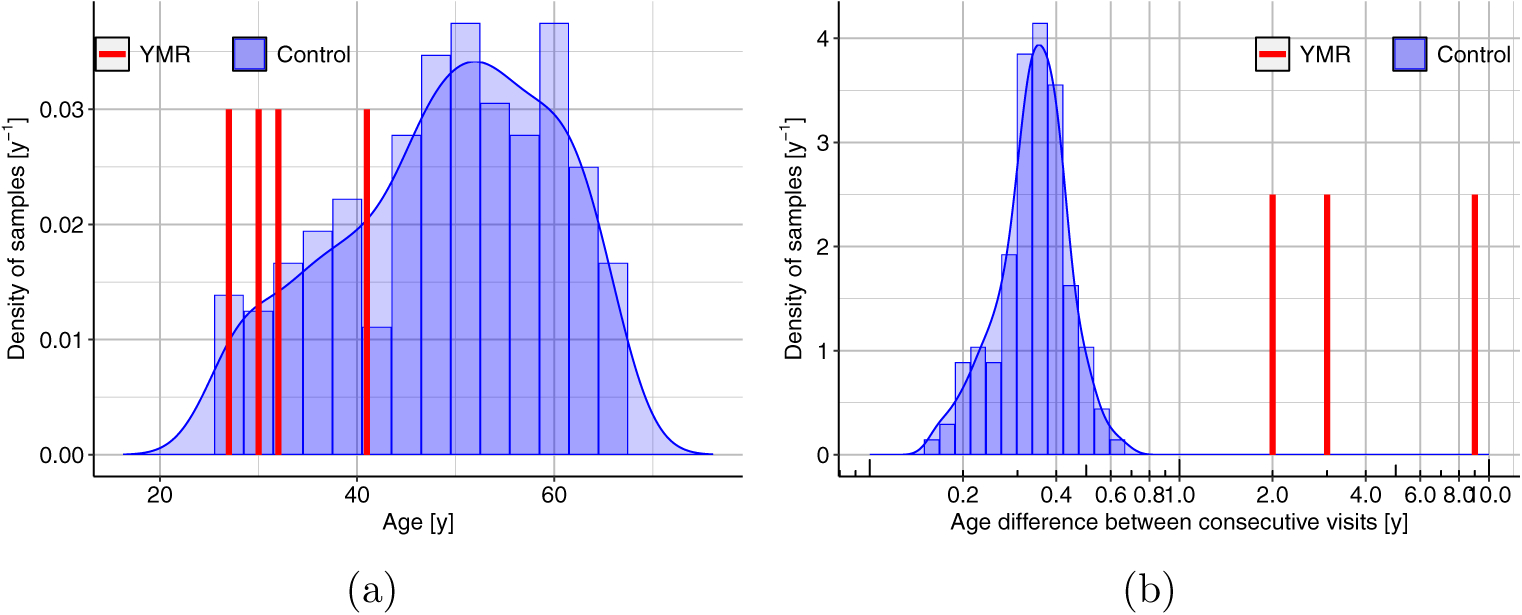
(a) Calendar ages. (b) Calendar age intervals between consecutive MRI visits. Since the longitudinal age differences for the controls were all less than one year, and those for YMR were all two or more years, the control data were treated cross-sectionally. With less than a year age difference for controls, the longitudinal change curves would not capture the rates of changes that would be needed to compare against data on YMR.