
Figure 2.: Representative slices of YMR’s brain from the different years he volunteered.
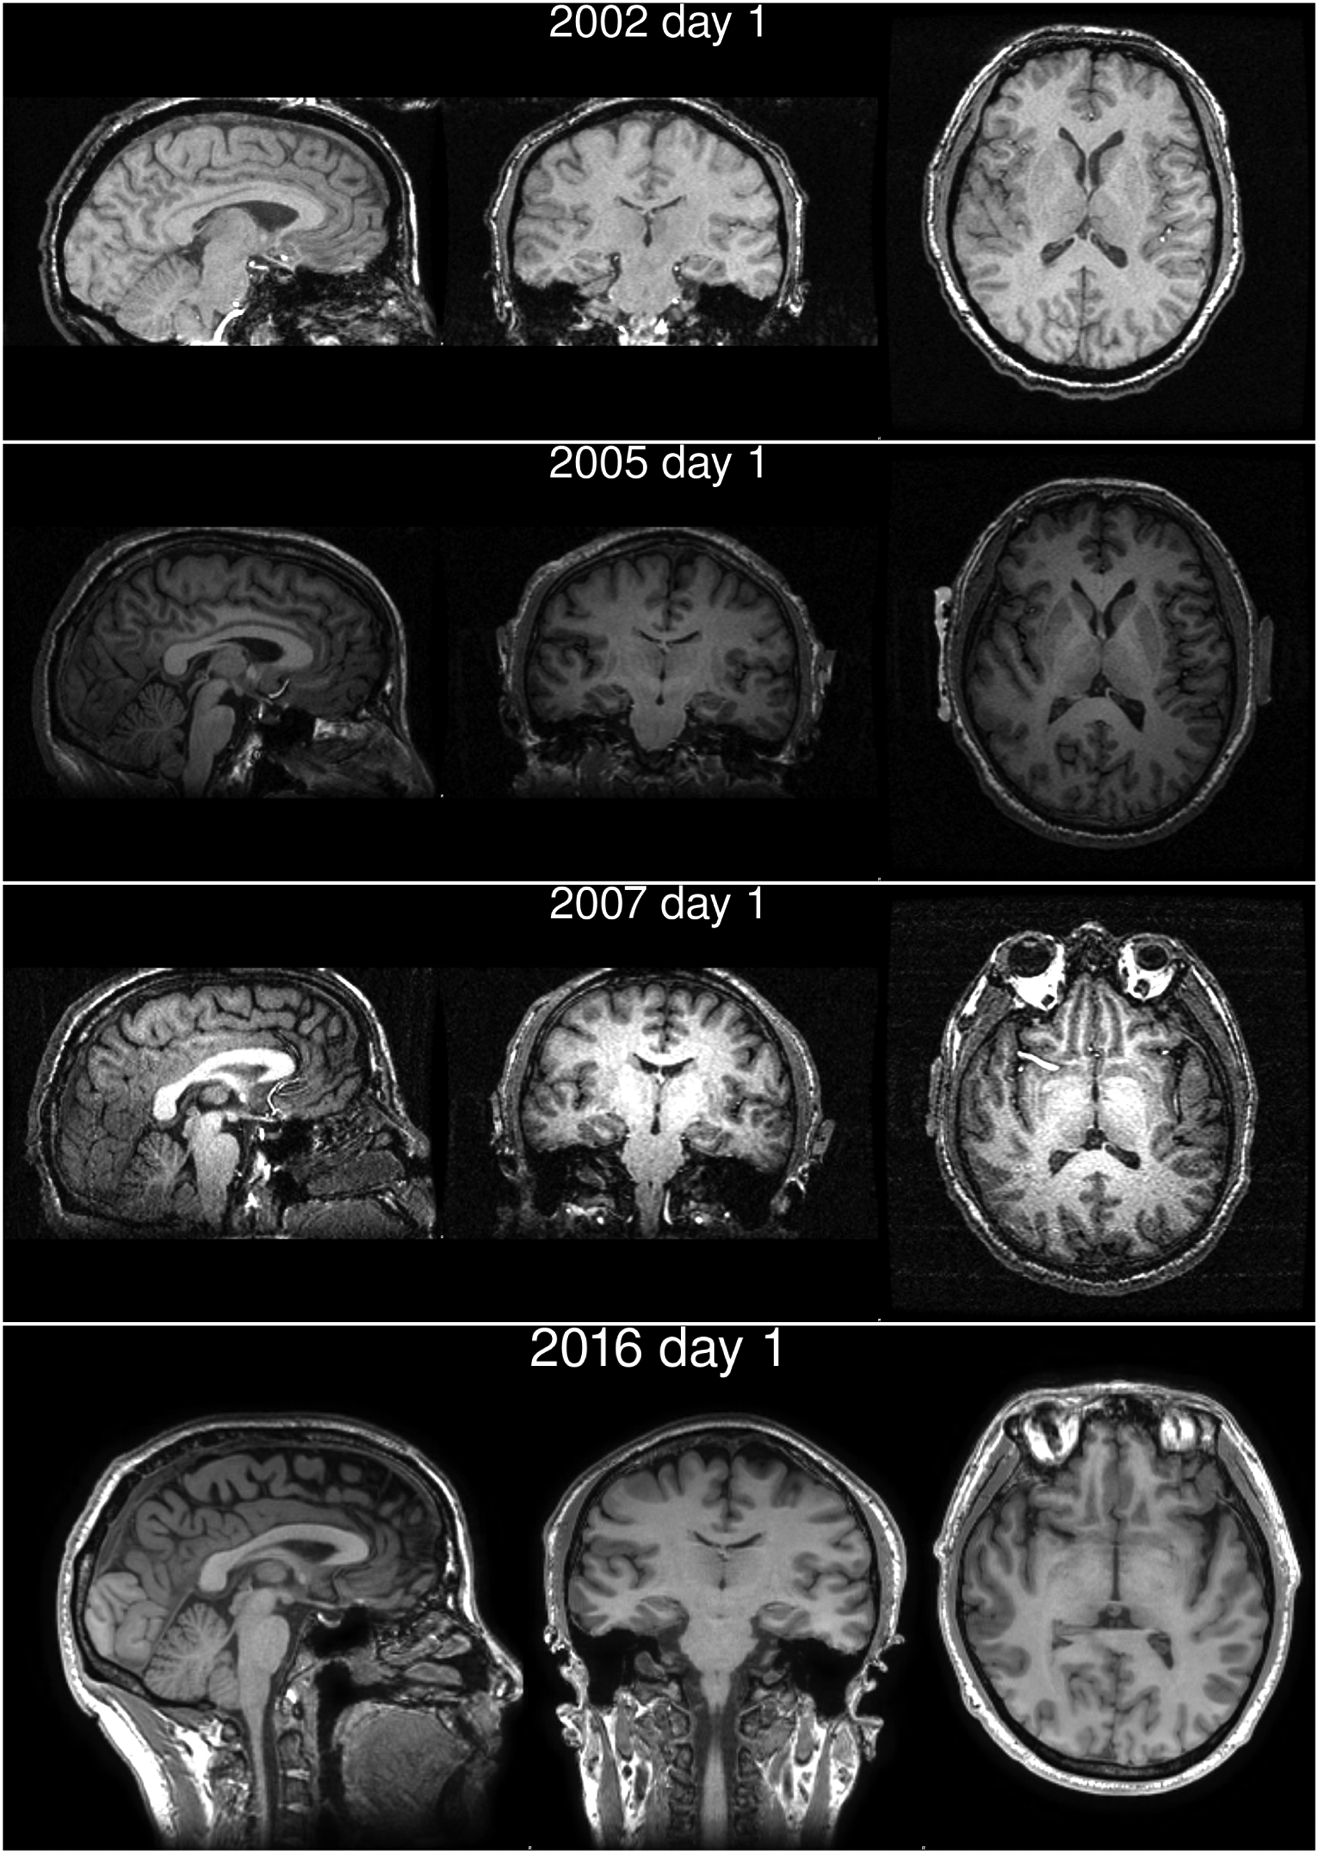
Image intensities are shown with the same window levels across the years. Changes in the bias levels of those intensities were accounted for by the processing pipeline (Fig. 3) and the BrainAGE estimation framework. (Franke et al., 2013, 2015, 2012, 2014, 2010; Luders et al., 2016).