
Figure 4.: Quality control.
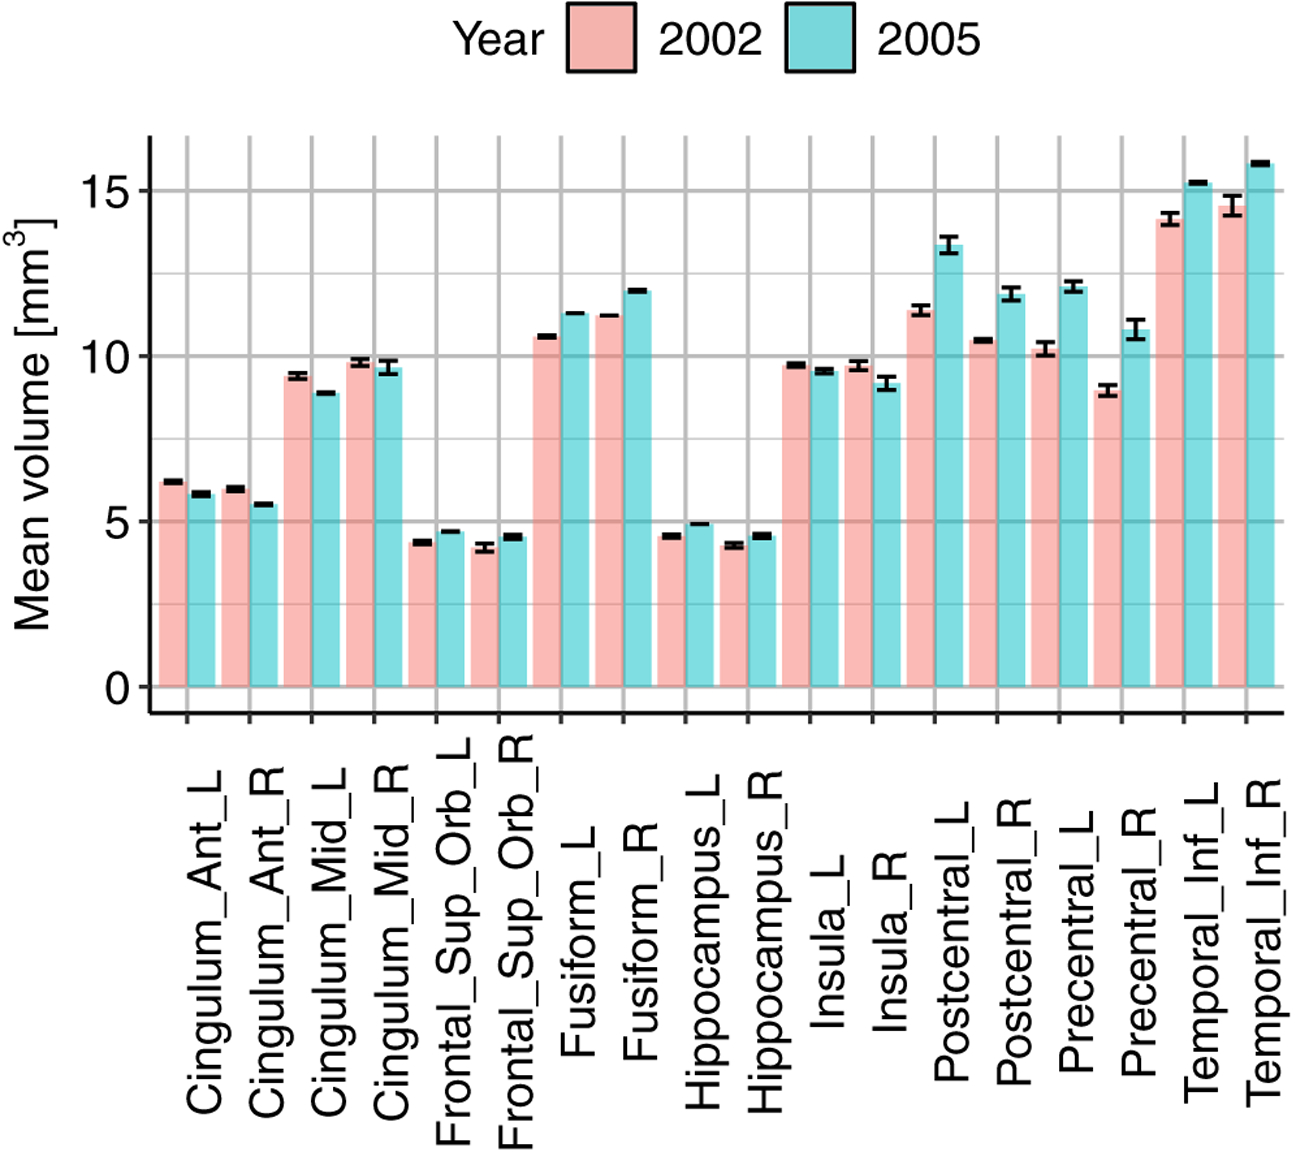
The noise variability of the regional volumes was computed for the data from the years 2002 and 2005, the earliest data available on YMR. The data were acquired on three and two consecutive days, respectively. Variability was low, providing support for the reliability of the data for downstream statistical analysis.