
Figure 6.: BrainAGE results.
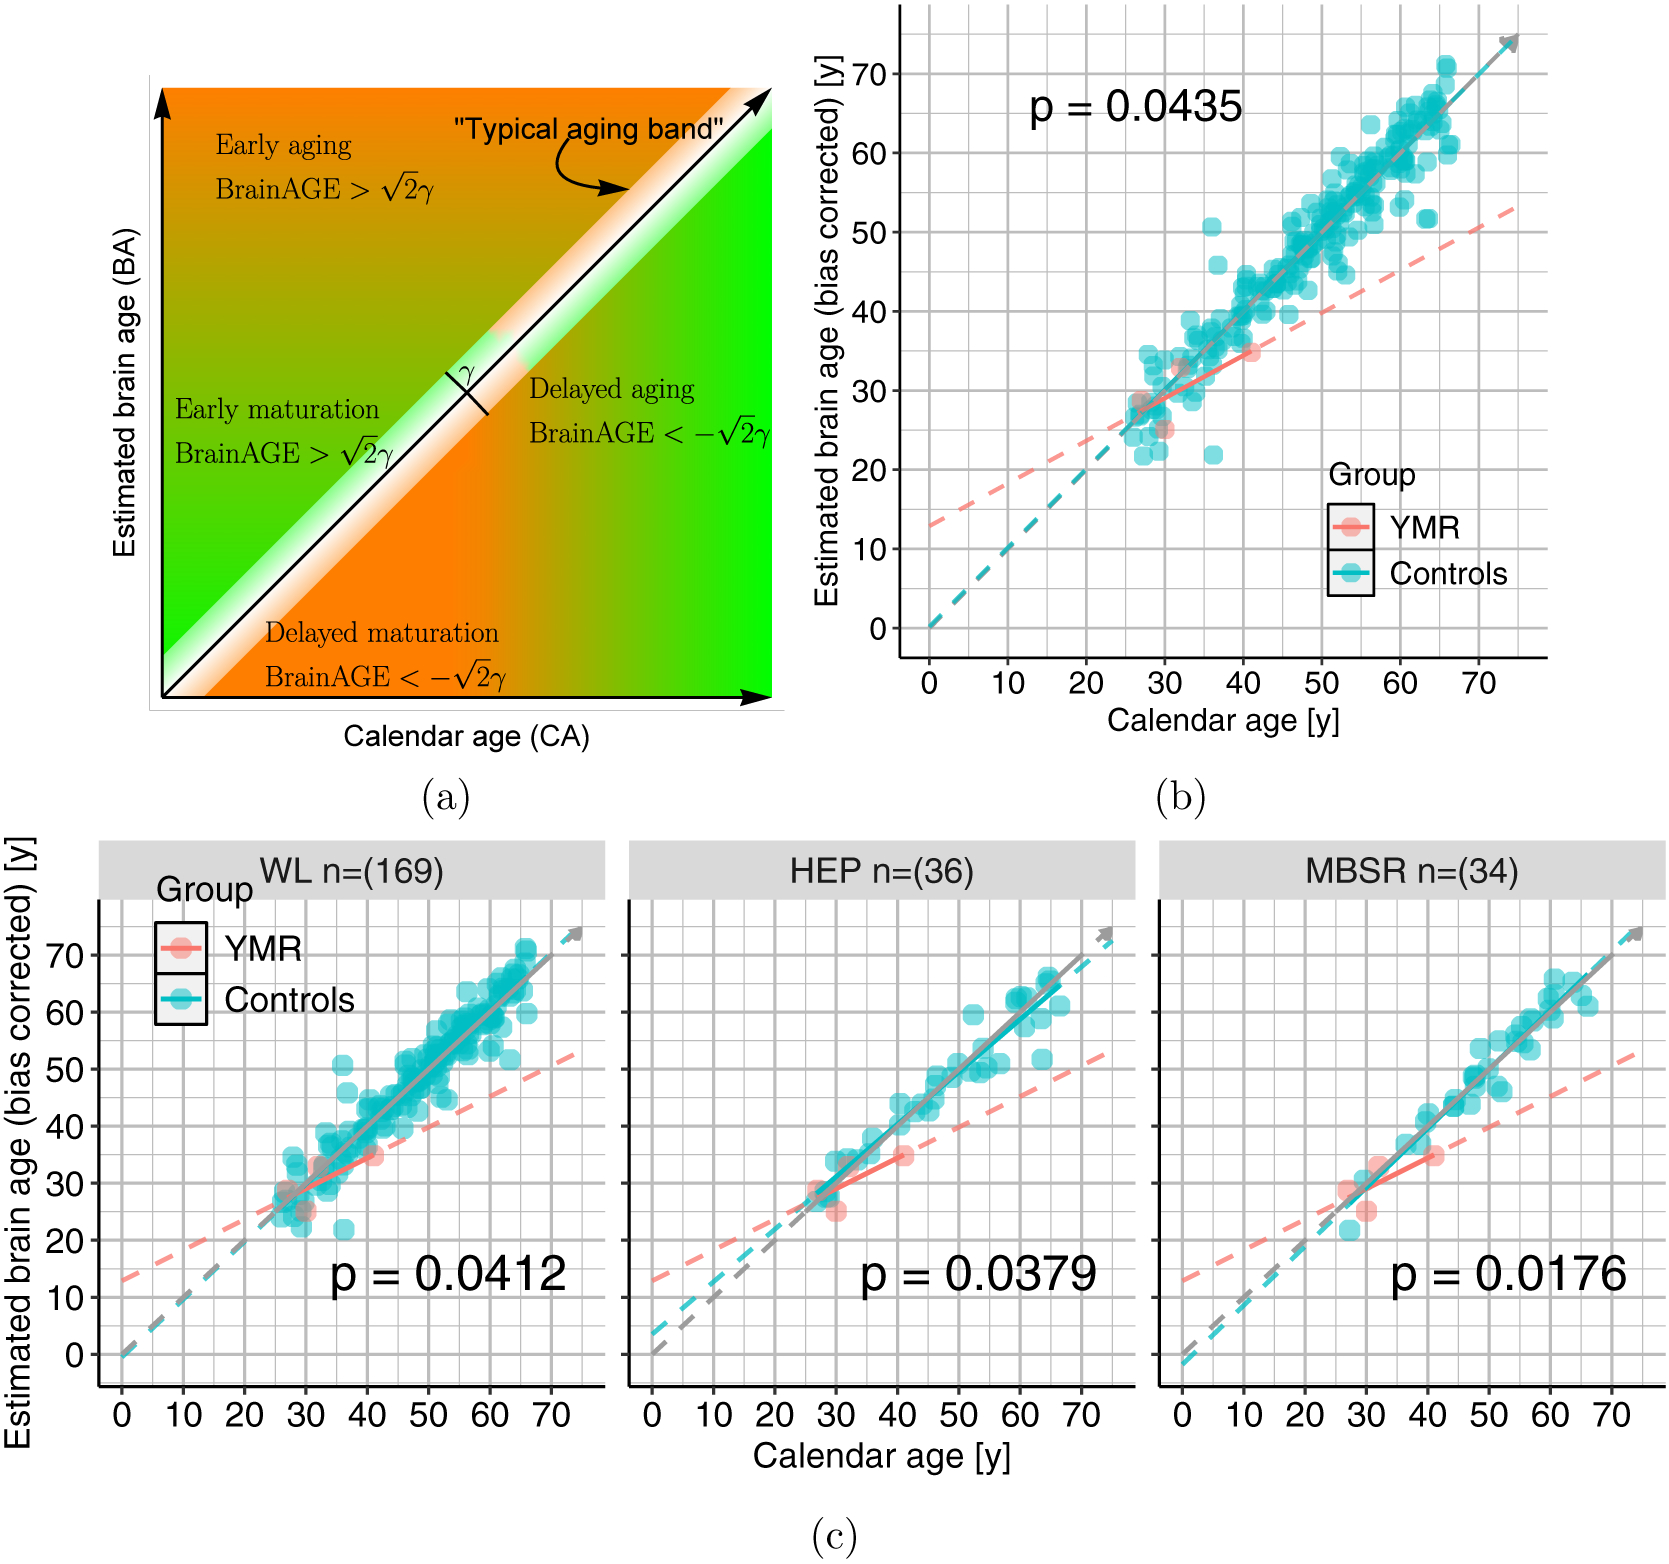
(a) Qualitative classification of the space spanned by estimated brain age and calendar age by BrainAGE (BA – CA). (b) Scatter plot showing the relationship between estimated brain age (BA) and the calendar age (CA) for YMR and the general population. The slope for the general population was β1 = .99, and the slope difference of YMR was β3 = −0.45, which was statistically significant at p = 0.0435. (c) Scatter plot showing the relationship between estimated brain age and calendar age contrasting YMR with the three control subgroups. The slope differences with respect to WL, HEP and MBSR are −0.47, −0.38, −0.5, respectively.