
Figure 7.:
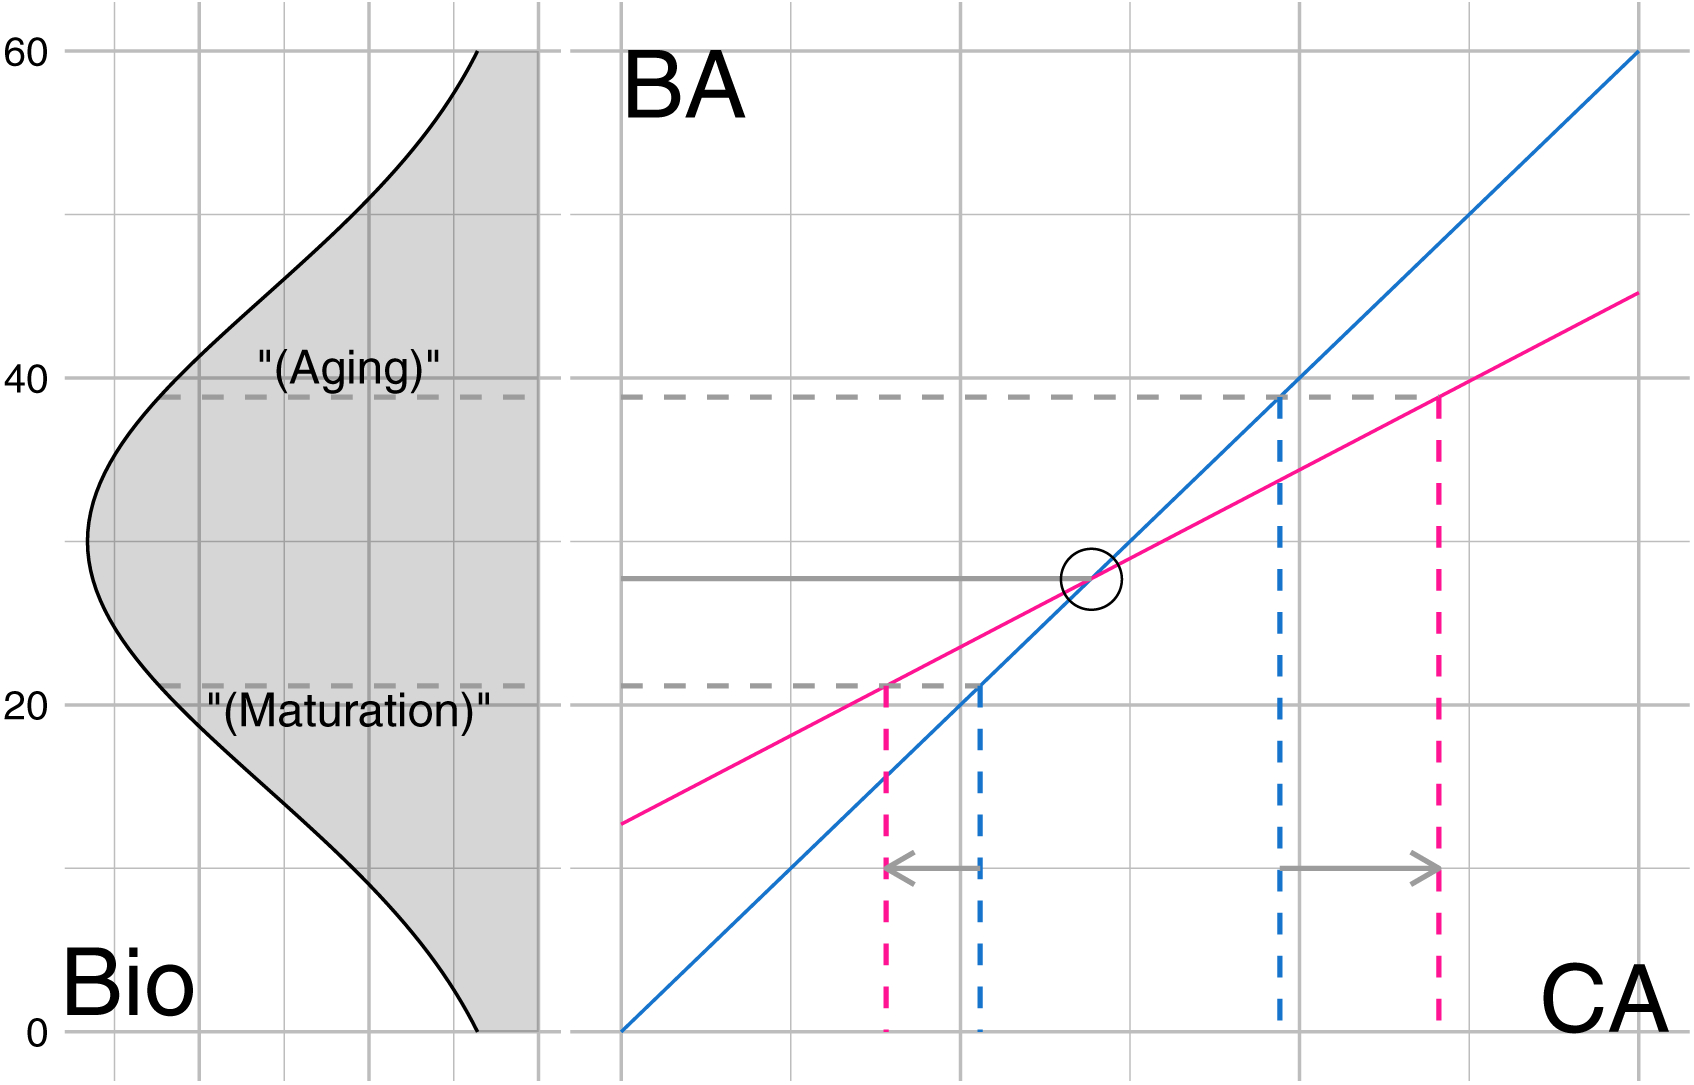
Conceptual graphic to demonstrate maturation and aging points. Left: growth and decay of some biological feature (Bio) (say gray matter volume) with the brain age (BA). Right: Depending on the relationship of the brain age with the calendar age, the maturation and aging points projected onto the calendar age (CA) can be shifted to the left (early maturation) or to the right (delayed aging).