
Figure 8.: Effects of bias correction.
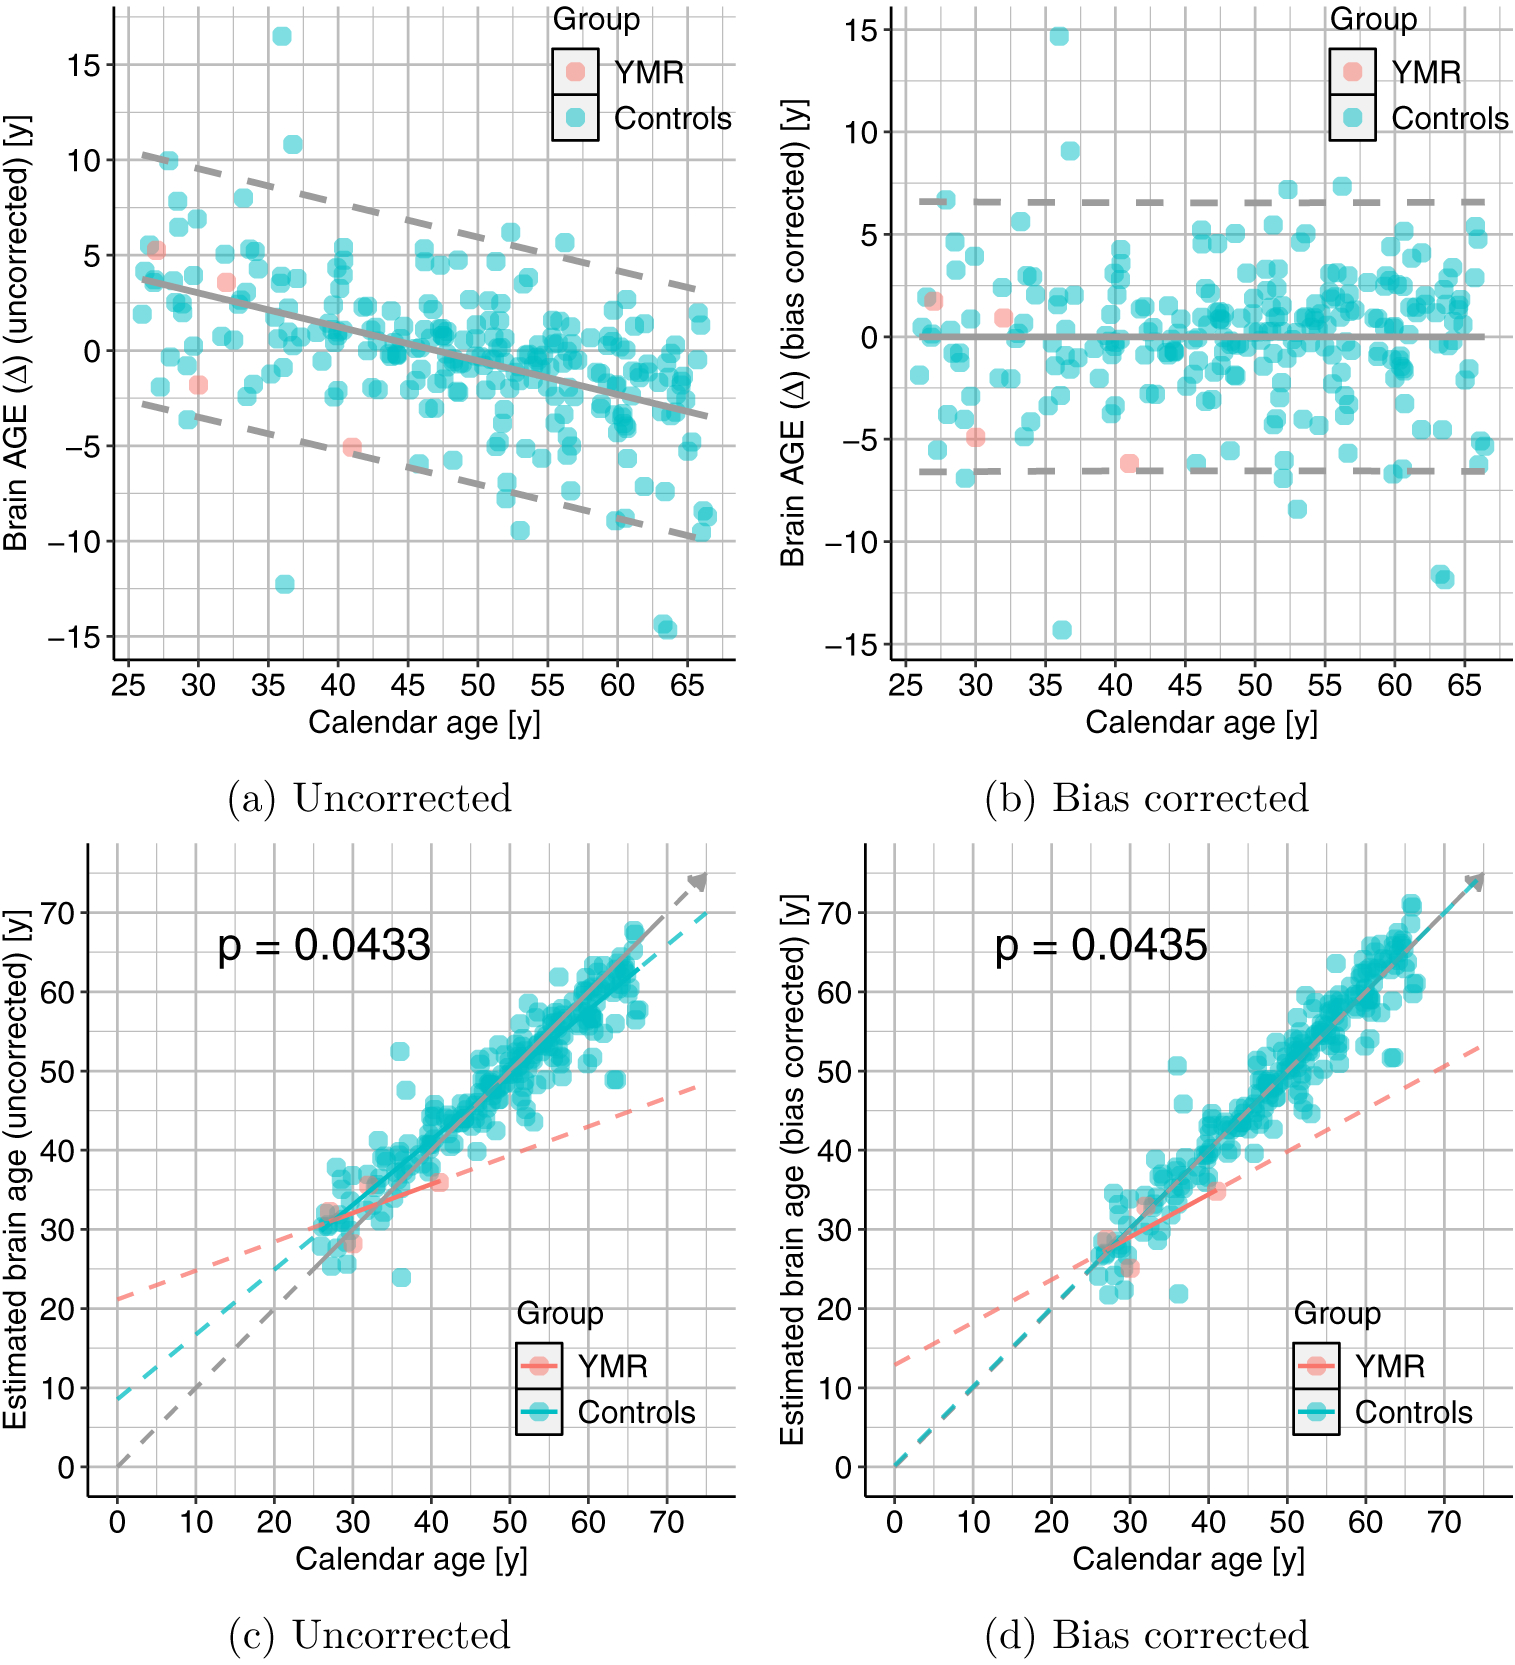
Scatter plots showing relationship between the calendar age (CA) and (top-panel:) BrainAGE (age gap estimation Δ) and (bottom-panel:) estimated brain age (BA). We can clearly see that the inverse relationship between Δ and CA is no longer present after the correction and the models in the bottom panel tend toward the diagonal. The p-value for the group difference test is only modestly affected.