
Figure 9.: Effects of bias correction.
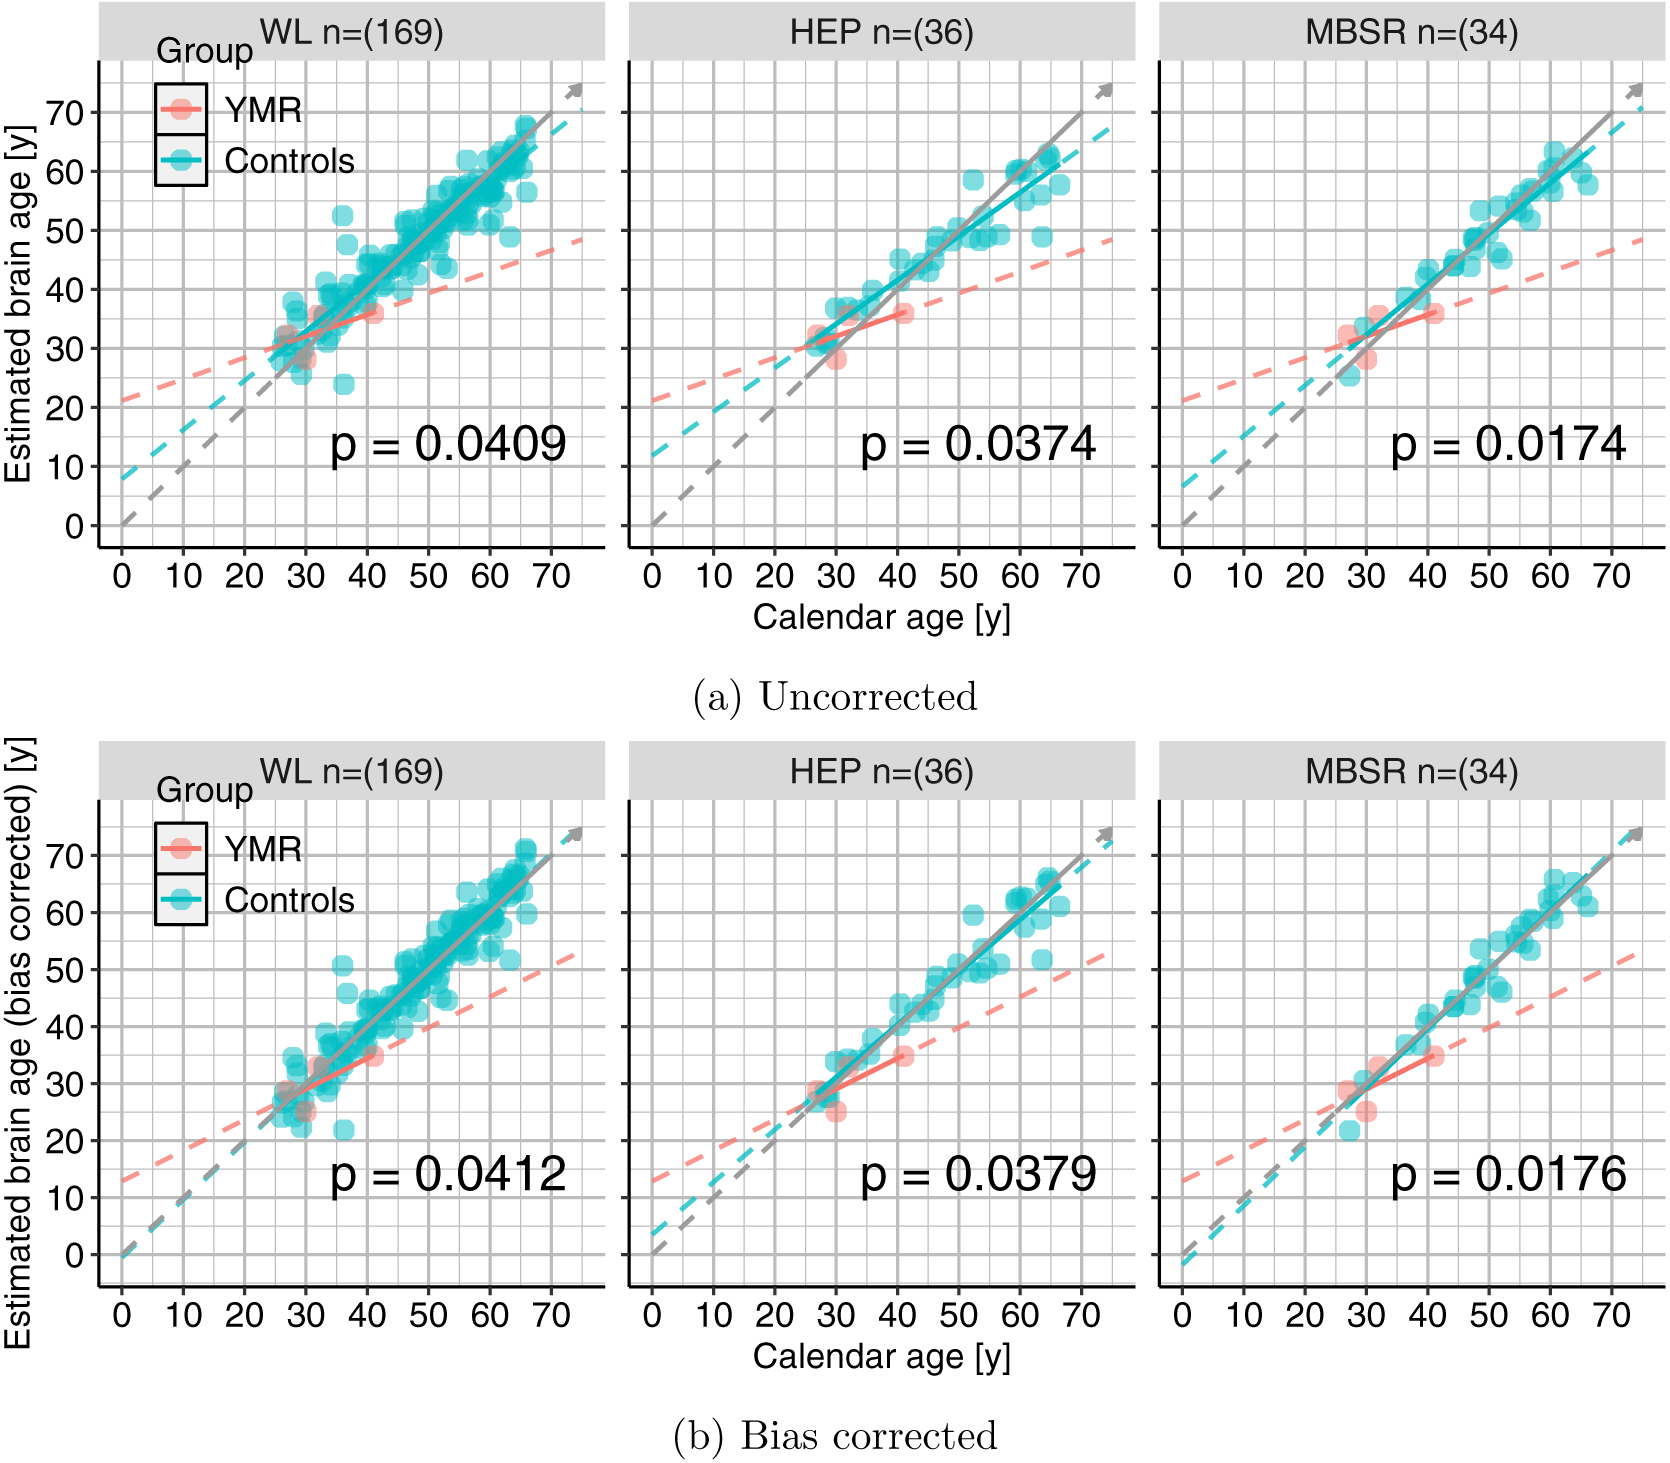
Plots similar to the bottom panel of Fig. 8 but for each of the three subgroups of controls. Top-panel shows those for uncorrected data and the bottom-panel shows the results with bias corrected data. We can again see that the linear models move towards the diagonal in all the three subgroups and p-values only modestly affected.