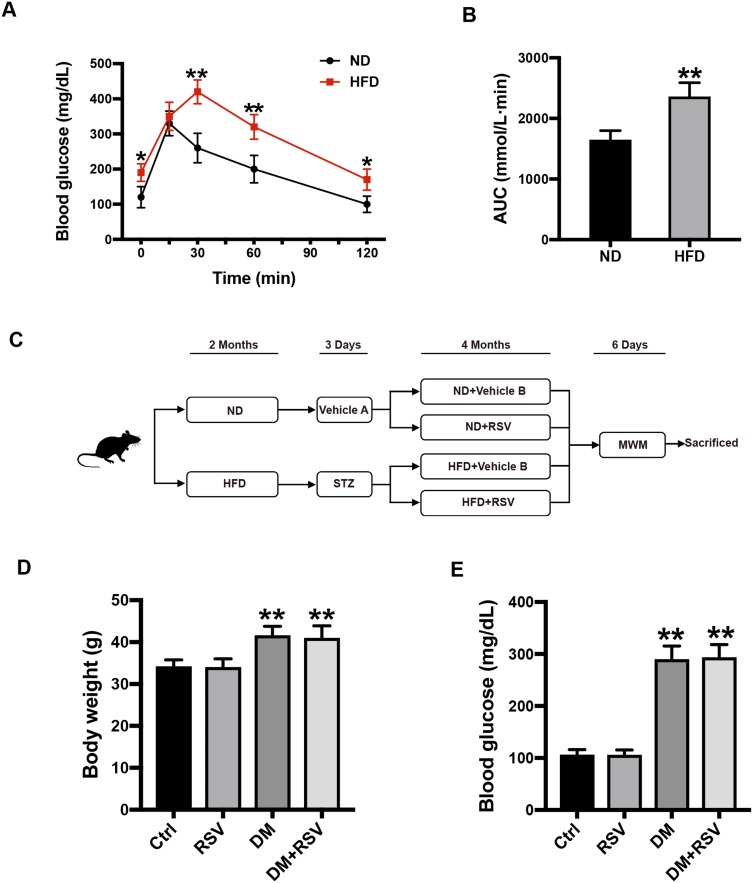
Figure 1.
Experimental design and intergroup metabolic parameter comparison. (A) IPGTT test two months after HFD induction. (B) The AUC of blood glucose in the IPGTT test. The data are expressed as the mean ± SD (n = 30). *P < 0.05, **P < 0.01 vs ND. (C) Schematic of the experimental process. (D, E) After 6 months of intervention in the mice, the body weights of the mice in the four groups were measured (D), and blood glucose levels were analyzed (E). The data are expressed as the mean ± SD (n = 15). **P < 0.01 vs Ctrl.
Abbreviations: IPGTT, intraperitoneal glucose tolerance test; HFD, high-fat diet; AUC, area under the curve.

